 As a follow up to my previous blog Configure Lighting Connect for SAP Access – Step by Step, I’d like to give Salesforce developers and administrators the ability to debug the Lightning Connection they had setup.
Before we get too involved in the debugging aspects of Lighting Connect you should understand that Salesforce has built this feature based upon the OData industry standard protocols.
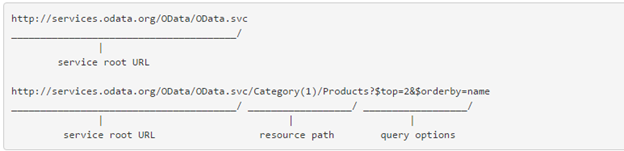
OData URLs have 3 primary components:
- Service Root URL – Specifies the computer you are accessing and which protocol you are using (OData of course!).
- Resource Path – The functional area you are accessing (sales orders, invoices, etc.).
- Query Options – These are additional parameters you can provide to the query string to filter the data.
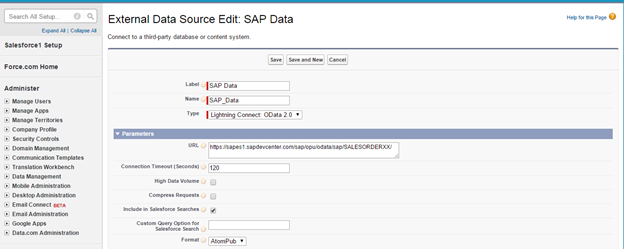
When you code Apex commands referencing external objects (e.g. mySAPdata__x), Salesforce converts your select statements into OData query options on the target service root URL you have specified. Compare this to the Lightning Connect setup you have created:
(This is just the Service Root URL and Resource Path; Salesforce will append query options according to the queries issued by your Apex code.)
Now that you have an understanding of the components of the Lightning Connect URL string, you can proceed to debug any issues you may have encountered.
There are a few ways to perform this debugging, some are better than others. Ideally you will be able to obtain an SAP logon with developer access to fully understand what is happening when you query the SAP system. However, you may not get the access you need so you may have to try some of the steps I have outlined here. They include:
Option 1 – Obtain an SAP Logon and set a breakpoint in SAP using SAPGUI (Best Method)
This is probably the best method, since you can see the results from BOTH sides of the connection, but company policy may restrict access to your SAP system. (Please note this method assumes you have already installed SAPGUI, a Windows desktop application to connect to the public SAP system. More on that in the next blog!)
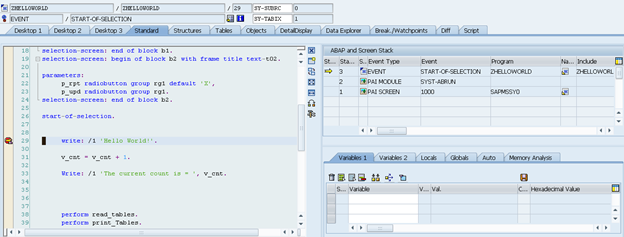
Using this method you can review the SAP ABAP (SAP’s programming language) instructions and determine if the OData connection and URL query string is returning the data that you expect. Ideally you might have access to make a coding change to correct any issues, but even if you don’t have access to make a programming change on the SAP side you could at least gain an understanding of what is happening in SAP and work with your SAP team to get the changes you require made.
Option 2 – Use OData Parameters to list data (Better Method)
Use parameters that are available to assist you in understanding the data that has been returned to you. Here you can use your browser to add different OData parameters to look at the results of a query without having to log onto the SAP system. You can just use your browser to pass parameters such as $metadata or ?sap-ds-debug=true to return some helpful information about your query to the SAP system.
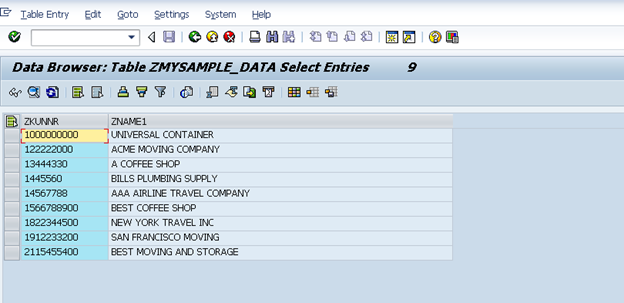
Option 3 – Request SE16 Listing of Data (Good Method)
Request that one of your SAP team members provide you with an SE16 List of the data you are trying to query. SE16 is a method to display table entries similar to using the Salesforce data loader to look at Salesforce data.
Since options 1 and 3 depend on input from others, I will focus on option 2 which will allow you the ability to perform some basic investigations yourself. You don’t have to be inside a Salesforce instance to perform these tests, since we are just viewing the data. Normally, you don’t have to be exposed to the 3rd component of the OData query string, since it’s handled automatically by your Apex calls, but in this case we wish to view our sample dataset to confirm we are properly returning data.
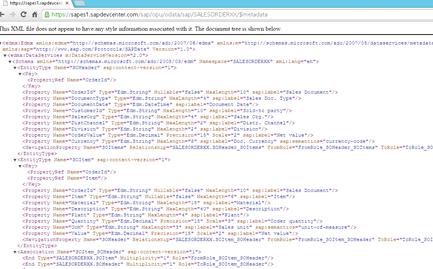
$metadata Query Parameter
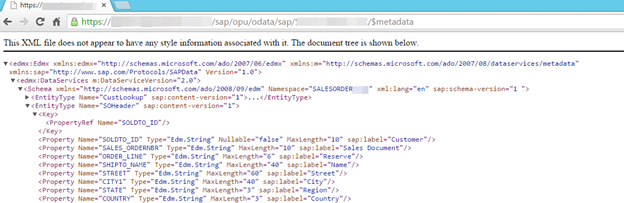
One of the first options is to view the defined data fields using the $metadata query. As mentioned above this returns you the field names and attributes (character or numeric) of each of the fields. If you open up your browser and enter the following URL string you can review the metadata returned from your SAP system.
Here’s a screen shot:
SAP “Debug” Parameter
Now that you understand the query portion of the URL, let’s try using the different commands that are available to you. One useful command that SAP provides is the Debug Command. This parameter helps you understand the components of your URL string and gives you “debugger like” tabs that you can inspect. When entering your URL string, append the debug parameter to your URL string like so:
SAP will respond with a formatted list that will help you understand how SAP has interpreted your OData query.
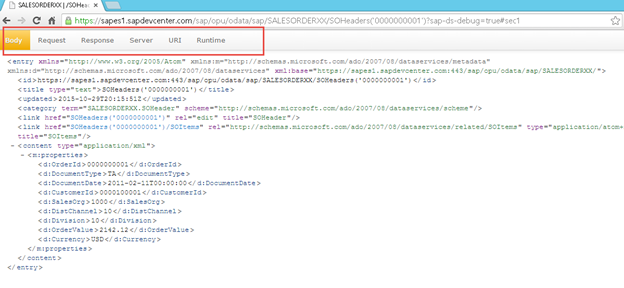
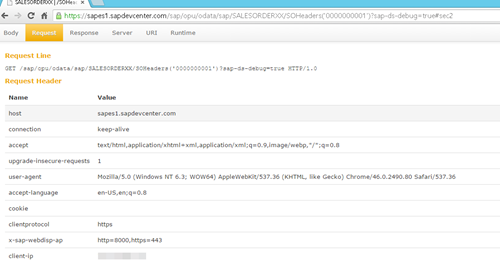
Note on the above screen you now have several tabs including Body, Request, Response, Server, URI and Runtime. Clicking each of these tabs will give you information about your OData query request. Here is the Request Tab of the OData query:
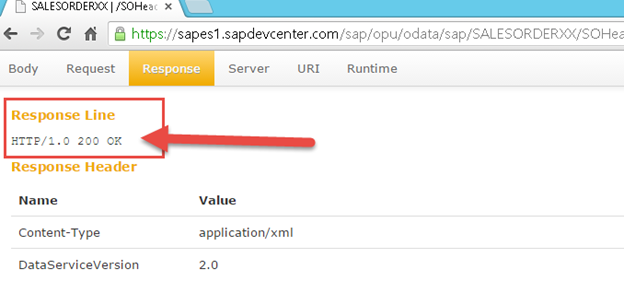
Here’s the Response Tab of the query; note the HTTP response status is “OK”:
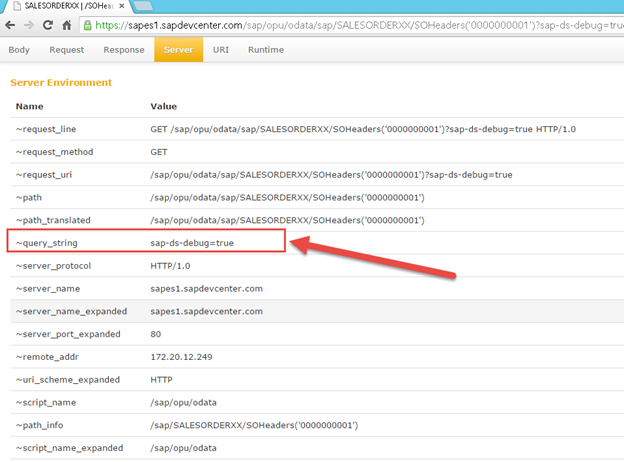
Here’s the Server Tab; note the “Query String” contains our debug option:
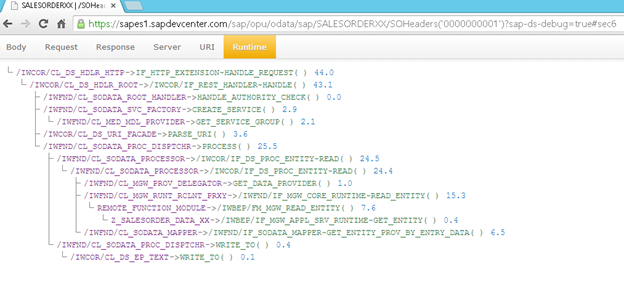
The Runtime Tab gives us a stack trace of the routines that were executed to complete the request, providing the names of the various SAP routines that are being called by SAP. Note the call to Z_SALESORDER_DATA_XX in this example. This is the user routine (similar to an Apex Class) that you can develop to read data from your SAP system.
While not the “perfect” way to debug, hopefully this blog can assist in showing you some options for the Salesforce developer/administrator to understand the SAP data that is being returned. If you have completed the first blog you have several sales order numbers that have been returned to you from the public SAP ERP instance. Why not try using the debug parameter with one of these sales order numbers and review your results?
I hope this next in a series of blog posting was helpful to the Salesforce developer / administrator! Time for another cup of Joe!

About the Author
Steve is an experienced Architect at SGC Software responsible for the design, development and deployment of enterprise class solutions for major corporate clients. He enjoys blogging and contributing where he can! Steve is a certified SAP ASAP methodology consultant, certified in Agile/SCRUM implementation methodologies and is passionate about helping non-profits/NGO’s and giving back! Please reach out to Steve if you require any help with your Salesforce system and need Pro Bono work for your non-profit / NGO.