The Wave dashboard designer is a new tool that helps you build responsive dashboards quickly and easily – for any device. You can rapidly create dashboards with predefined layouts that follow best-practices or create customized layouts to optimize your dashboard for the needs of your business. The designer tool provides features like drag-and-drop, snap-to-grid, and browser reflow to effortlessly add, position, and align widgets in a dashboard.
When building your dashboard, you can choose from a variety of ways to visualize your data. For example, if you want to view record-level details, you can add a values table. This type of table can display details about objects such as cases, including how long the case has been open and who owns it.
In Winter ’17, the Wave Dashboard Designer delivered a number of new features and usability enhancements. Unlike classic designer, the new Wave designer no longer supports SAQL queries in grain steps that power values tables. Thus, if you convert a classic designer dashboard with this type of values table to Wave designer, the grain step breaks. To fix the step in less than five minutes, continue reading this post.
Here’s a dashboard created using the classic designer with a values table powered by custom SAQL:
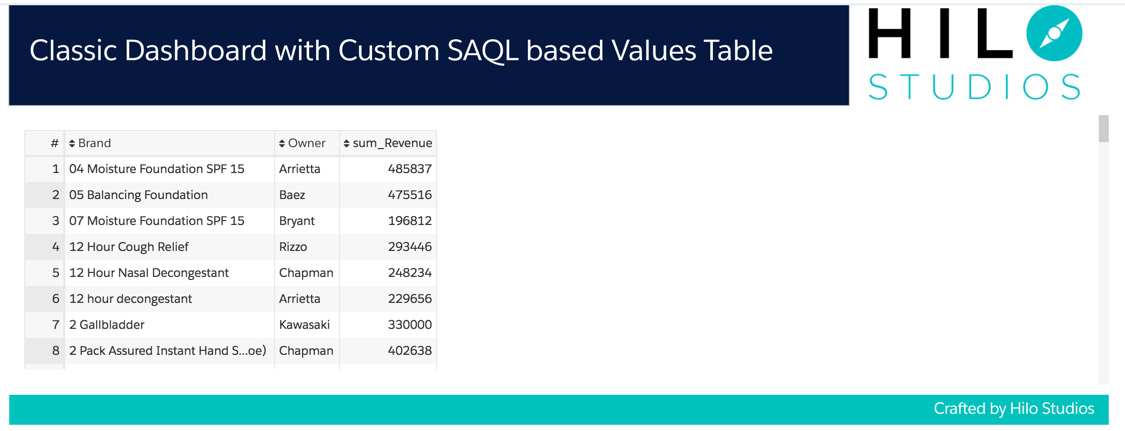
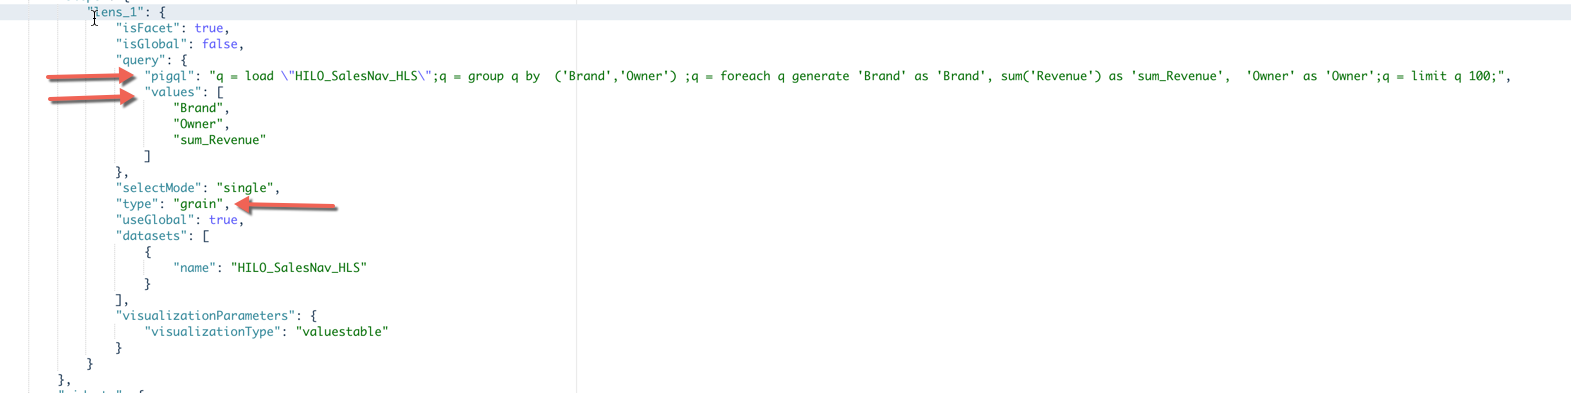
This particular values table is based on a grain step, where the query returns a sum of revenue grouped by Brand and Owner. The values node in the step lists all the items returned by the SAQL query.

If you click the “Wave Dashboard Designer” button to convert your classic designer dashboard to the new Wave designer, the values table widget will display an error as shown below.

If you click More Details, you’ll see the error details, like this:

To fix the step, change the step type from grain to aggregateflex in the dashboard JSON. Also, replace the values node with the new groups and measures definitions in the query node of the aggregateflex step. To do that, copy all the dimensions from the values node and add them to the groups node. And, add the measure in the values node to the measures node.
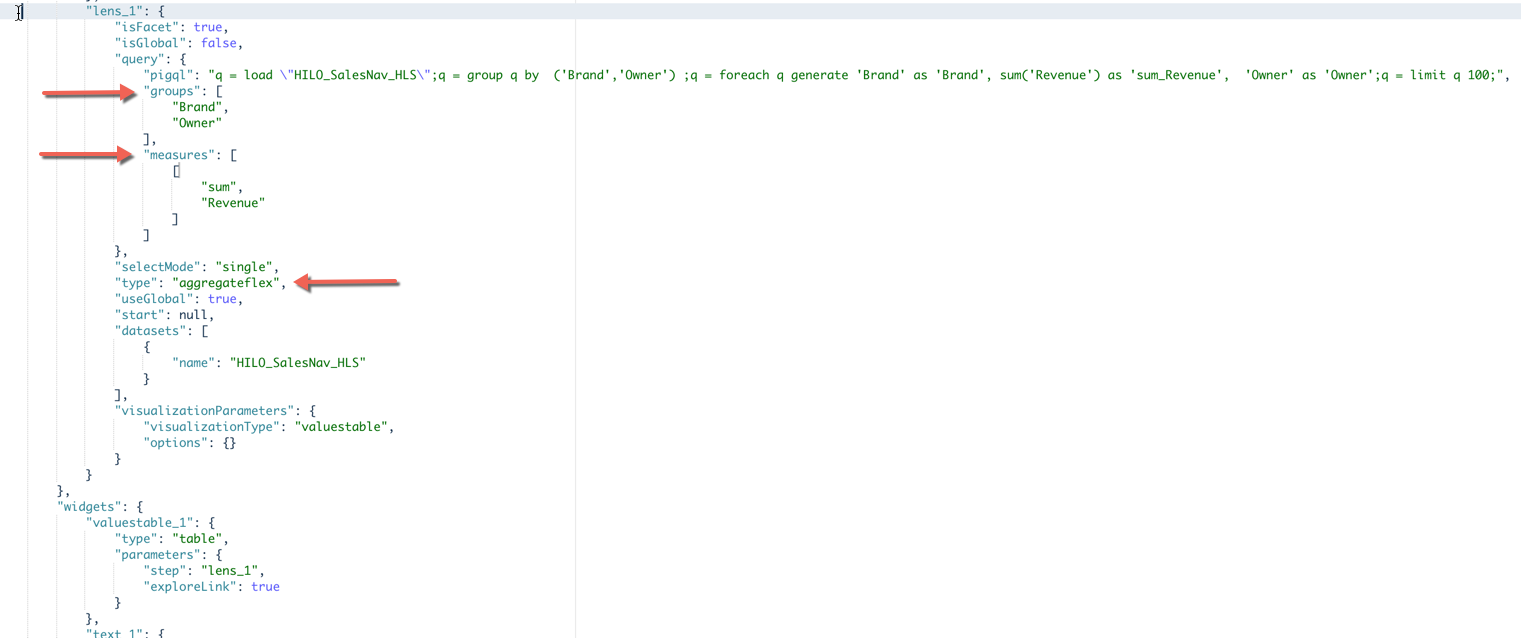
After you make these changes, hit Done. Viola, your values table comes back to life!

For more Analytics Cloud developer resources please visit https://developer.salesforce.com/page/analytics.
About the Authors
Danny Lai is a Product Manager and Dashboard Curator at Salesforce.
Kaushik @kaushforce Ruparel is a Co-Founder & CTO at Hilo Studios (A Salesforce Analytics Apps Company) and is at the leading edge of Wave. He is dedicated to building game changing analytic applications and providing architectural advice and best practices for everything Wave.
Kaush is a former member of the Salesforce Analytics Cloud’s Advanced Solutions Group / Wave Center of Excellence. He can be reached at @kaushforce or at www.hilostudios.com.