If you’ve built an application on the Force.com platform, you want to deliver a great experience to your users. But how can you tell if your applications are performing well and will continue to perform well? Using the Developer Console, you can use “performance profiling” to identify and fix performance hotspots, and ensure that your applications are both fast and scalable.
Performance Profiling on the Force.com Platform
 Like troubleshooting and debugging, performance profiling is an important part of building well-performing applications, and it allows you to proactively inspect and uncover potential issues (i.e., performance bottlenecks). Using performance profiling techniques, you can identify performance hotspots and effectively apply performance best practices. For example, along with using functional unit testing to verify that your application is working as designed, you can also use performance profiling to ensure that your application is coded to properly handle the volumes of data and complex sharing configurations that might grow along with your organization.
A typical, high-level flow of a performance profiling task would look something like this.
- Measure the performance of an application (i.e., a Visualforce page) and identify potential bottlenecks.
- Identify and fix the bottlenecks’ root causes.
- Compare results and repeat steps 1 and 2 until you remove the bottlenecks or minimize their effects.
Iterate on the previous performance profiling steps with larger data volumes and with users who have various different sharing settings so that you can gauge performance impacts as comprehensively as possible.
To begin performance profiling, you need:
- A user who has a System Administrator profile and development mode enabled. If you don’t already have a user with that profile, ask your administrator to create one or create one yourself in your own Developer Edition organization for free.
- A non-administrator Salesforce user who will be actually using the application
To illustrate the profiling methodology—and to avoid focusing too much on how to resolve the poorly performing code—let’s look at a very simple scenario.
The following basic Visualforce page displays total sales amounts and numbers of active sales orders, both of which are grouped by opportunity stage name.

Use the following sample code, which should work out of the box for any Developer Edition or sandbox organization. If you are new to Visualforce, start with the Visualforce Developer’s Guide and Visualforce Workbook.
Visualforce page source:
Apex Controller source:
Visualforce page Debug Logs in the Developer Console
Although you can use the Developer Console to run blocks of Apex code anonymously, you cannot use it to render Visualforce pages. Before jumping to the Developer Console, you must first collect the debug information you’ll need for performance profiling. If you have multiple Visualforce components in your page, you might want to take them apart and profile them one by one, unless they have dependencies and affect the performance of one another.
Step 1 – To obtain logs for your Visualforce page, you must use two users: an administrator user to set up and analyze the debug logs, and a non-administrator, test user to access the Visualforce page. Have the test user set up with appropriate permissions and sharing configurations so that you can later access the Visualforce page. From a separate browser, use your administrator user to enable the debug log for your test user.
Tip: Set your debug log filter by choosing the appropriate log levels so that you can focus on areas related to what your application does and what you would like to profile. This image shows some sample settings that would work for this scenario.

Step 2 – With the test user, execute the request by accessing the Visualforce page and completing any operations you want to profile. Note that you can capture only 20 logs per user.
Step 3 – With the administrator, open the Developer Console, then open the test user’s log.
Tip: Your new logs might be hidden. Deselect “Show my Current Logs Only” or filter by entering the Visualforce page name as your keyword.
Step 4 – Always disable debug logs after you’ve collected the information that you need.
Using the Developer Console to Profile Visualforce Pages
Now that you have a log to work on, start with a high-level analysis to find which part of your request is taking the longest. Move the panes (panel borders) around to make the console look like this. This layout will allow you to focus on the information related to performance profiling.
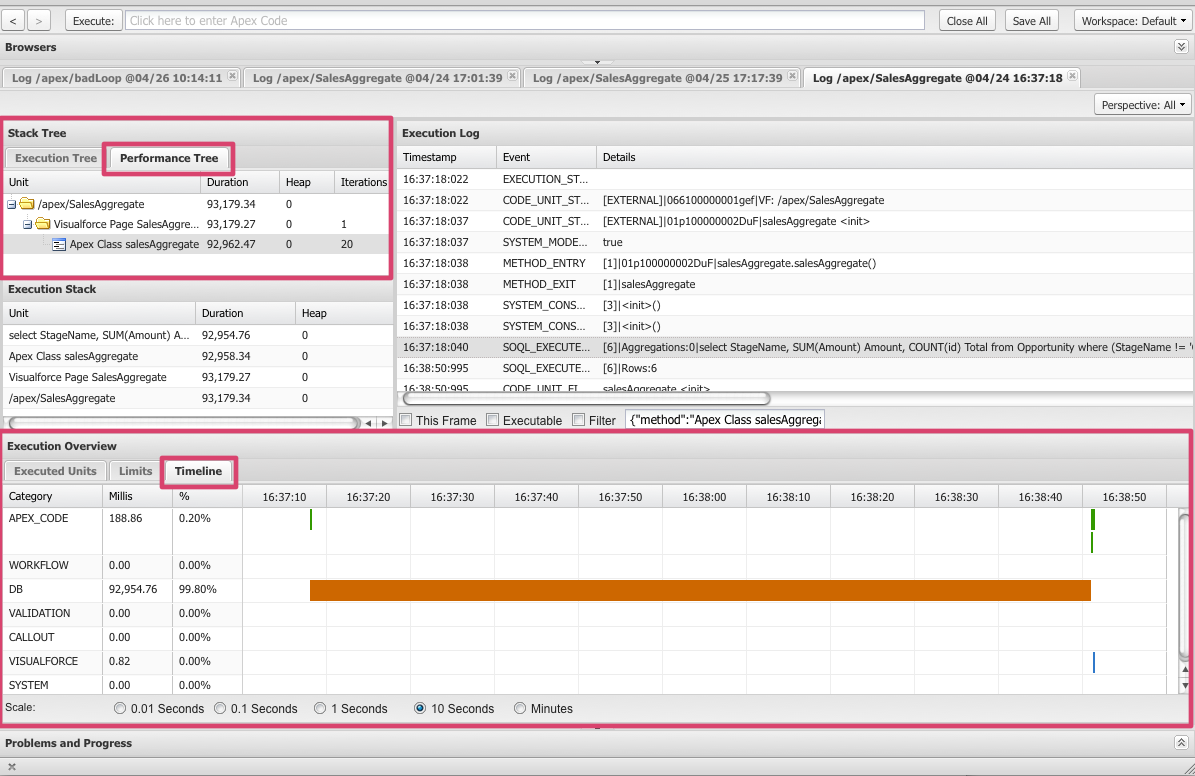
Step 1 – Open the Timeline chart by clicking on the Timeline tab in the Execution Overview panel. This will give you a good visual representation of the duration for each type of transactions. In the previous example, the database query is taking the majority (92.95 seconds / 99.8%) of the total execution time.
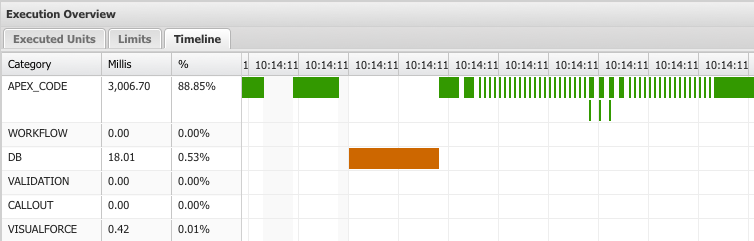
Depending on your case, you might see something less obvious. For example, shorter bursts of Apex events might get executed repeatedly and add up to a significant amount of the overall execution time. The following example shows how such a request would look. The narrow green vertical lines represent those repeated bursts, which are usually caused by inefficient Apex loop logic.
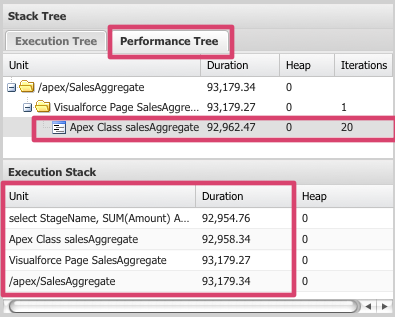
Step 2 – Next, identify what this “DB” (database) event is. From the Stack Tree panel, click the Performance Tree tab and expand the tree. This panel will give you a breakdown with the corresponding duration in milliseconds, the heap size, and the iterations for each component executed for your request. Work your way down from the event that has the longest duration. Because this example is very simple, you see only one component from the main Apex controller class. By looking at the Execution Stack, you can see that a SOQL SELECT statement took the majority of the execution time.
Step 3 – Now look into the log lines for more details. In this case, we identified that a database query took a long time to execute. Open the Execution Log panel and select “Filter” to get the relevant information needed to identify the bottleneck(s)—filter by the event “SOQL_EXECUTE” as shown in this screenshot.

Tip: If you are uncertain about which kind of keyword to use, click the “Unit” that appears to be the bottleneck (have the longest duration) on the Performance Tree tab. A filter is applied automatically. If you look at the Execution Log panel, you can spot the gap in timestamps. Disable the filter and look at the events that fall in this gap.
Step 4 – You have now identified a SOQL statement that requires review and tuning.
Step 5 – Repeat the same steps using different users (e.g., a user with limited data visibility vs. an administrator with access to all data) and larger volumes of data.
Things to Consider when Profiling on the Force.com Platform
When profiling, consider the following.
- Governor limits – Use the keyword “LIMIT_USAGE” in the Execution Log to review cumulative limit usage. Identify areas that are close to reaching limits.
- Database cache effects – While it is ideal to obtain benchmarks based on requests without the cache effects, you cannot prevent a transaction from using the cache. When testing, make sure you do multiple runs and compare numbers based on similar conditions. For example, if you began testing with user A, run your test a few times. Most likely, subsequent tests will run faster, up to a certain point. Similarly, when you switch to user B, follow the same strategy and run the test a few times. Compare the results under similar conditions (in this case, with the caching benefits).
- The use of indexes – For performance profiling at the query level, you cannot determine if your SOQL request actually uses an index or not. However, you can test and see how the query performs without the index by swapping your query with a custom field that does not have any custom index on it. Once you get the baseline performance, you can create an index on that custom field or switch back to the original field that has an index.
Next Steps
Once you’ve profiled your application and identified the bottleneck(s) (e.g., poorly performing SOQL or Apex logic), verify that your application follows performance best practices. After making modifications, you can iterate and use the same methodology to confirm whether your performance tuning was successful.
Tip: Because companies use different types of Salesforce organizations for different purposes, and because Salesforce uses a multitenant architecture, each Salesforce instance has its own transaction and load patterns. While identifying bottlenecks and verifying tuning efforts are valid profiling activities that you can do in any environment, do not assume you will see the same performance results when you move to your production organization.
Summary
The debug log and the Developer Console are performance profiling tools available to you out of the box, and you can use them to proactively identify performance bottlenecks and subjectively compare test results. Understanding best practices for optimizing performance is important—but when you’re trying to build scalable, well-performing applications—applying those best practices in your implementation is even more important.
Related Resources
- Webinar: Advanced Testing & Debugging Using the Developer Console
- Webinar: Diving into the Developer Console
- Developer Console
- Working with the Developer Console
- Performance Tuning for Visualforce and Apex
- Architect Core Resources
About the Author and CCE Technical Enablement
Daisuke Kawamoto is an Architect Evangelist within the Technical Enablement team of the salesforce.com Customer-Centric Engineering group. The team’s mission is to help customers understand how to implement technically sound salesforce.com solutions. Check out all of the resources that this team maintains on the Architect Core Resources page of Developer Force.