
It’s important to understand what your customers are doing on your site. It’s even more important to understand how they’re using your site. If something goes wrong and the end user has a bad experience, it reflects poorly on the company. At salesforce.com we take this seriously. One of the main indicators we use to gauge if a customer is having a good experience is looking at how long it takes for a page of the Salesforce web application to load on the browser. We currently use an end user performance tool called jiffy to accomplish this. This post covers a version we’re open sourcing and how we’re using it to influence current and future design of our product.
Currently being used by the Salesforce Platform
I have had many Force.com developers ask me, “What is JiffyStubs.js? It’s this little JavaScript file that sits at the top of every page, it’s impossible to get rid of, and doesn’t do much”.
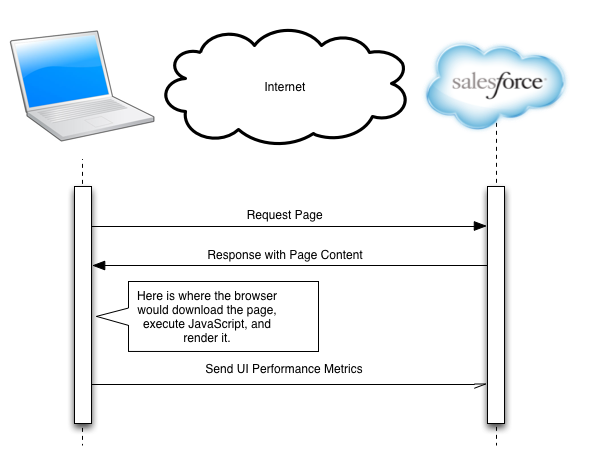
This is actually a very powerful piece of code. Well… maybe not this code, but what it connects to is very powerful. We can change monitoring settings on a pod on-demand, and and tell it which org, which user(s), and for how long it should track the UI performance of the pages he/she visits. When this setting is enabled, JiffyStubs.js is replaced with a URL pointing to Jiffy.js . Jiffy.js contains JavaScript code for tracking how long the page takes to load on the browser. It looks from the perspective of when the link or button was clicked to when the page is fully loaded in the browser. By “fully loaded”, I mean when the page is completely rendered in the browser and all important JavaScript has finished executing. It also captures a few other metrics:
- memory usage of the browser
- number of DOM nodes
- time spent on the server processing the request
- time spent in the browser handling the request
- any custom measurements that the Salesforce developers have added
- Navigation Timing metrics
Once captured, we “beacon” or send the information back to the Salesforce pod where it can be analyzed for performance problems, or merged with other information to help find trends that are useful in making the product better.
It’s important to understand that salesforce.com never collects any user-entered data in this process. This is against our corporate policy and agreements. What we do look at are performance metrics and information about the browser being used.
When would we want to capture metrics about UI (User Interface) / web page performance? Typically it happens when a customer calls in and reports a performance problem. Not just any performance problem, but one where we do not see any problems in back-end / server response time. We have a very good handle on app server performance and database performance because your requests are running on our hardware and we have tuned it make it as efficient as possible. When you add in the UI, it is running over the Internet (where we have little control) and on customer laptops, desktops, tablets, phones, etc with any type of browser from IE6 onwards, it cannot be 100% optimized because we do not know all of the variables that could affect it.
Open source Jiffy known as Kylie
Recently we release an open source UI framework called Aura (see blog post) that can be used to create dynamic websites and will be available to use from the Salesforce platform. Following these lines, we decided to open source our UI performance metrics collecting framework (Jiffy). As part of this initiative we renamed it Kylie and it can be downloaded from https://goo.gl/6q90ct . We named it Kylie because we forked the project from another one called Boomerang and “in the Western Australian Aboriginal language Noongar, the settlers took the word Kiley/Kylie/Koilee to mean curved, returning stick or ‘boomerang’” ref. For this version we stripped out anything specific to running on the salesforce.com platform so that it can be applied to any platform or UI framework (already compatable with Aura).
How to integrate Kylie with your project
So, you have your own website and are interested in collecting browser and speed metrics of your site. Kylie makes all of this very easy to achieve this. Right out of the box Kylie will collect metrics for you. With a little bit of extra work, it can send the data back to the server for analysis.
Below is the minimum code to install Kylie on your site.
<script src=”http://your-cdn.host.com/path/to/perf.js”></script>
…
<body onload=”Perf.onLoad()”>
Put a reference to download perf.js to the browser and call Perf.onLoad() when the page is 100% ready for the user to start interacting with it.
What happens if you want to beacon the data back to the server? There are 2 ways to do it.
- Compile your own copy of Kylie from source and include a command line flag to set the URL to send the data make
- Include on the page a JavaScript variable which contains the URL
Now that you’ve gathered metrics, you realize that a big chunk of time is spent in the browser and you are wondering what it is doing. Kylie provides functionality to instrument the code with custom time measurements. It will use a starting time called with an identifier, Perf.mark(“Twain”); and an ending time called with the same identifier, Perf.endMark(“Twain”); . There are other great features built into the framework such as transaction boundaries (for AJAX heavy sites), stats collection, metrics logging levels, and more. Many of them are documented on the Kylie Github page. For more detail, take a look at the source code out on Github, it’s very well documented.
On a side note: you may be asking why we call the file perf and reference the JavaScript object as Perf. We do this so if we want to switch from Kylie to something else in the future we do not have any references to implementation we are using for gathering metrics and we can swap out the framework rather easily.
Here is a framework that salesforce.com Engineering believes is not only critical to triaging problems with our own platform, but will also be useful other developers and companies trying to keep their websites running fast. Feel free to report any bugs or issues you encounter. We’re really interested in receiving input from the developer community and making this framework better.