We’ve all been there. You’re trying to create a beautiful, serene scene in your sand garden, but the surface is all lumpy and uneven. You’re feeling anything but tranquil. You’d like to be contemplating Zen koans or the writings of Plato, but you’re too distracted. Something isn’t right.
What could be causing this? Dun dun DUNNNNNN! Looks like there are bugs in your code!
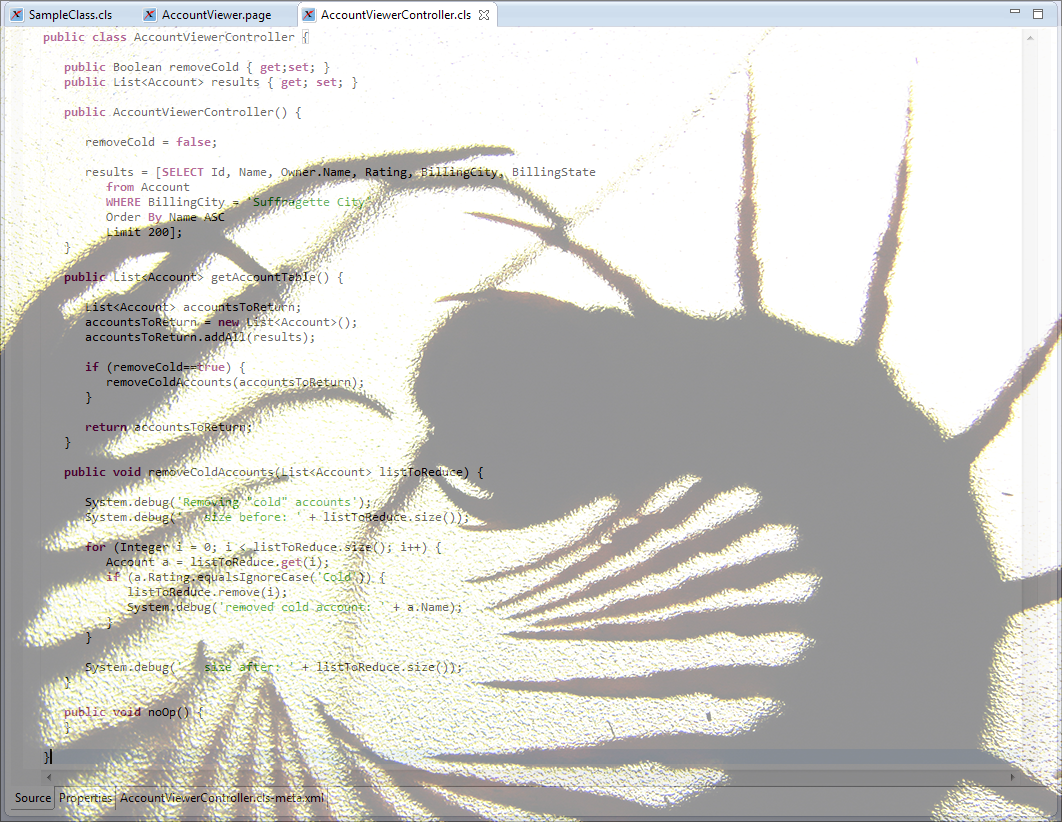
Plagued by Bugs
These bugs cast pretty clear shadows on the wall of your cave, but understanding them can be tricky. Salesforce provides a variety of useful debugging tools—trace flags, debug logs, the System.debug() method, checkpoints, and so on—but we’ve heard from customers that you want a debugger like the ones you’ve used for other programming languages. And so, we’ve been hard at work in the code mines, building a multitenant debugger that you can use to dig out even your most deeply buried bugs.
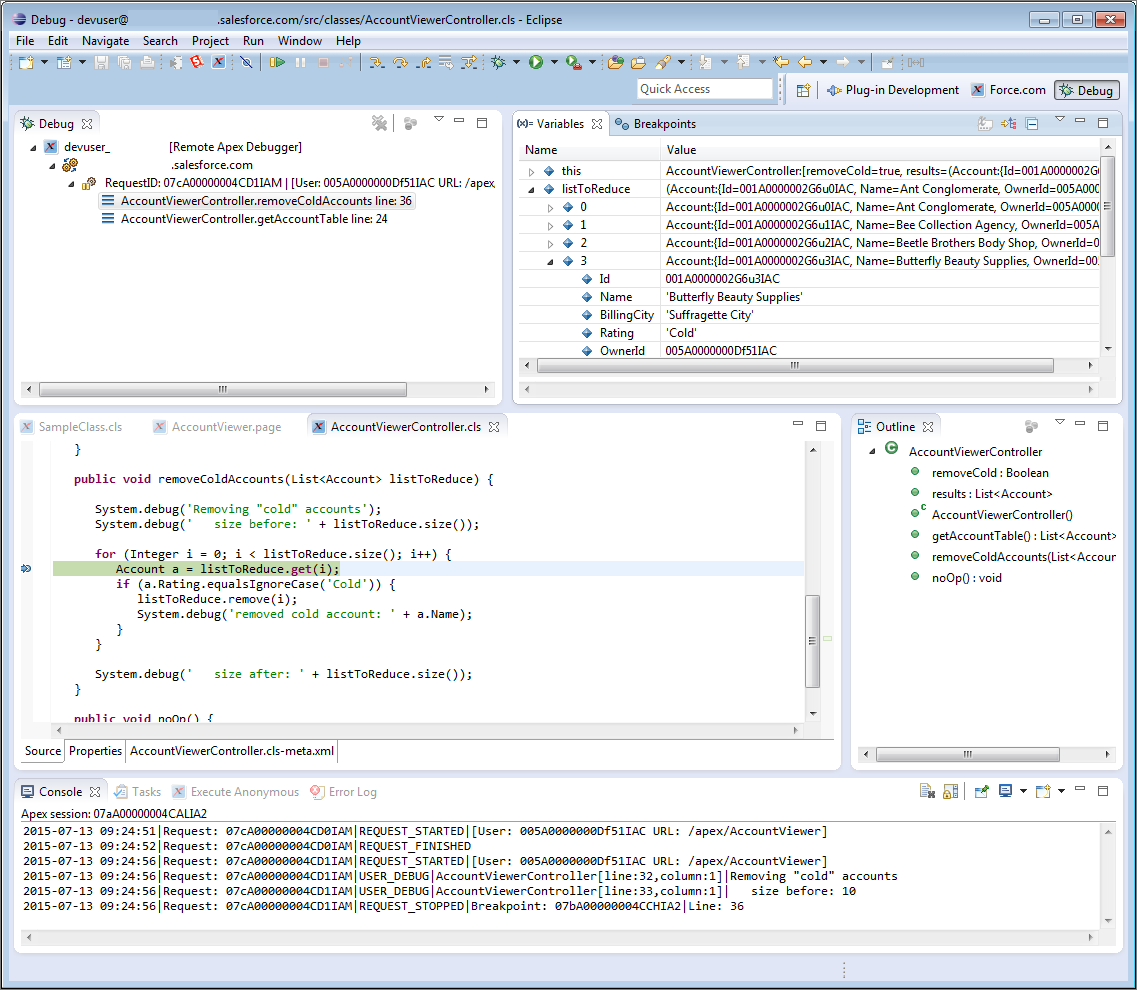
Rescued by the Apex Interactive Debugger
The Apex Interactive Debugger extends the Force.com IDE plug-in for Eclipse and does most of the things you expect a debugger to do. Use it to:
-
Set breakpoints in Apex classes and triggers.
-
View variables, including sObject types, collections, and Apex System types.
-
View the call stack, including triggers activated by Apex Data Manipulation Language (DML), method-to-method calls, and variables.
-
Interact with global classes, exceptions, and triggers from your installed managed packages. (When you inspect objects that have managed types which aren’t visible to you, only global variables are displayed in the variable inspection pane.)
-
Complete standard debugging actions, including step into, over, and out, and run to breakpoint.
-
Output your results to the Console window.
The Debugger was used by a limited group of pilot customers in Summer ’15. In Winter ’16, we made it generally available and unleashed it on a wider group of sandboxes. Yours could be among them! Some services and subscriptions include this feature for an extra cost. For pricing details, contact your Salesforce account executive.
You can read more about the Apex Interactive Debugger, and work through a simple debugging puzzle, in the Force.com IDE Developer Guide. The Force.com IDE doc was formerly available only in Eclipse, but we recently made it available on the Salesforce Developers website.
Imagine that you’ve dug out all your deeply buried bugs and have restored order to your sandbox. You’ve documented your process, lining the bugs that you’ve defeated up next to your sand garden as a cautionary tale to future sandbox users. You’ve even added some lovely new lines (of code). Life is pretty good. But somehow, it still feels like something is missing…
What if just having a bug-free sand garden isn’t enough for you? What if you want to add decorative stones? Salesforce doesn’t provide decorative stones! How can you possibly continue to thrive?
Working Together for Continuous Improvement
We do our very best to provide you with the tools you need to succeed, but we’re only human. There are only so many hours in our work day, and we can’t build everything we’d like to. But that no longer needs to restrict you, because you have open-source Salesforce developer tools to chisel with!
-
In Summer ’14 (Force.com IDE v31.0), we made the Force.com IDE’s core source code available on GitHub.
-
In Spring ’15 (Force.com IDE v33.0), the Force.com IDE includes several community-submitted contributions.
-
The customer-visible contributions are even highlighted in our official Force.com IDE Release Notes.
-
In the future, we hope to open-source the Debugger as well—Safe Harbor!—but at this point only the core Eclipse plug-in and the WSDL2Apex tool are open source.
Have you encountered issues when using the Force.com IDE? You’re not alone. Now, you can work with other members of the Salesforce Developers community to resolve those issues. And working through our issues makes everyone feel more satisfied. If you want decorative stones in your sand garden, by all means go ahead and put some there. Other developers will thank you for helping make their sand gardens more beautiful.
Here at Salesforce, your success is what motivates us. We don’t like buggy code any more than you do. We’re working toward a brighter, less bug-infested future. We hope you’ll join us.
Ruth Sears
As a Senior Technical Writer on the Platform Documentation team, Ruth works with the Platform Developer Tools team. She’s been at Salesforce since April 2014. In addition to writing documentation and playing with Salesforce’s developer tools, she enjoys working with Earthforce on sustainability-related issues.