Did you know that you can generate really nice diagrams of your test coverage? How? Well, write some Apex and some tests.
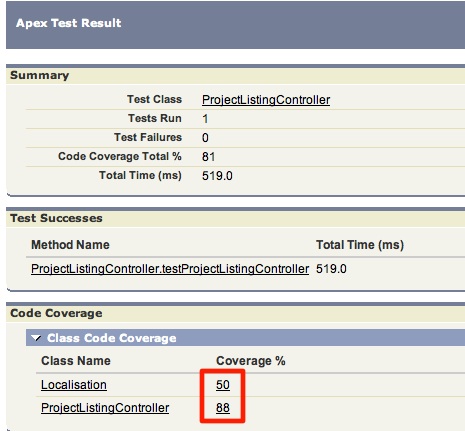
In the online builder environment, navigate to Setup | Develop | Apex Classes. Then select your class and hit Run Tests. You’ll see something like this:
What isn’t too obvious, is that you can click on those numbers. If you do, you’ll see a little popup like this one:

The blue bits are the code that has coverage. Red lines don’t have coverage. And the numbers along the side indicate how many times the lines were executed when exercised by the tests.