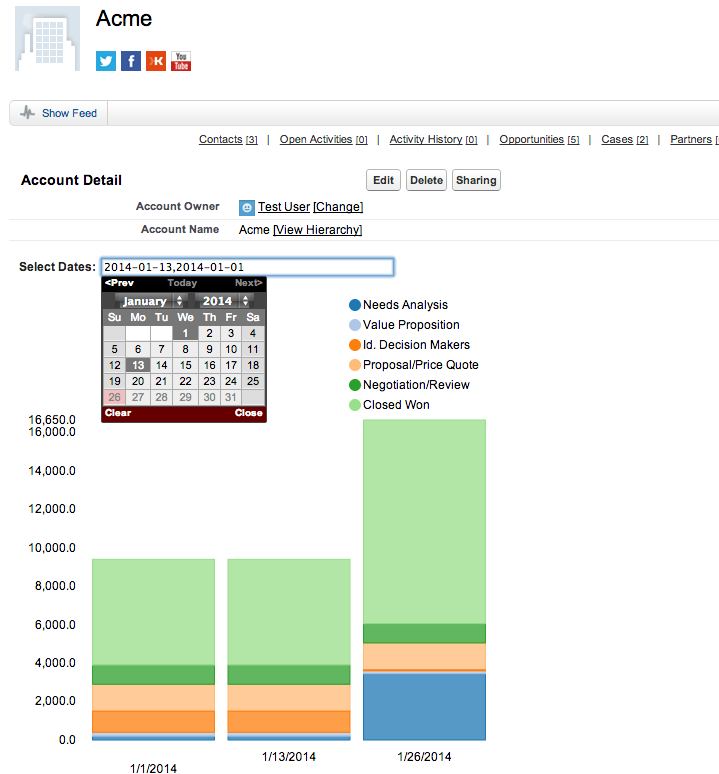
With the Spring’14 release the Salesforce Analytics API allows users to dynamically choose date and get historical data. To understand how we can take advantage of this enhancement, lets take a look at the following screenshot.

What’s the Problem?
Imagine you are a sales manager who wants to look at the open pipeline for an account and compare it to what it was at the beginning of the week or even beginning of the month. To achieve this in any traditional business system it would require access to the data-warehousing system — a time-consuming and expensive process. With a simple custom app built on the Analytics API, you could fulfill this business requirement and visualize historical trends.
Visualize Historical Trends with the Analytics API
In Winter’14, Salesforce launched the Historical Reporting feature that provides easy real-time access to current and historical data within reports. Starting in Spring’14, these reports are not only available in the Analytics API but they can also be dynamically configured to change the snapshot dates.
You can define historical snapshot dates when you filter the report metadata in your JSON response object:
You can combine the power of Visualforce, JavaScript, D3 Charts, and the Analytics API to spin up a solution to empower any team with historical data. By embedding a page that displays report data on a page layout, a dynamic jQuery data selector can take a it a notch further to grab that report data in the right context to boot.
Build Your Own Historical Charts
Check out the Analytics API Developer Guide to start building charts with the Analytics API today! Thanks to Arun Varadharajan for the breakdown for this post and the sample code which can be found on GitHub. To test it yourself, enable Historical Trending in Setup (App Setup > Customize > Reports & Dashboards > Historical Trending) for the object you want to start creating historical data for. Once enabled, the historical type will become available in the standard report builder, and you can use that report to build your historical chart!