In this guide, you can learn about both the Force.com performance profiling tools and their associated methodologies, which have been informed by recommendations from salesforce.com Customer Support and our own engineering teams. For example, along with using functional unit testing to verify that your application is working as designed, salesforce.com recommends using performance profiling so that your application can handle the volumes of data and the complex sharing configurations that might grow along with the size and success of your organization. If you’re a Force.com architect or developer, or an experienced Salesforce administrator, then these kinds of tips can help you properly code your application and maximize the value that it delivers to your users.
Note: This guide is intended for readers who have experience coding Apex and Visualforce, and who have a basic understanding of the Force.com multitenant architecture.
Overview of performance profiling tools and resources
We encourage you to familiarize yourself with these performance profiling tools and resources, using both these short descriptions and the more comprehensive resources associated with the links above those descriptions.
The Developer Console
The Developer Console is a collection of tools that you can use to create, debug, and test applications in your Salesforce organization. The Developer Console provides a number of panels dedicated to analyzing performance. Based on detailed execution logs, which you can open by using the Log Inspector associated with the Logs tab, you can view the graphical timeline of the overall request, the aggregated performance of an operation, and statistics on governor limits, as well as drill down to the executed units. In this guide, we use the Developer Console as our main tool for walking you through the performance profiling process.
Debug logs
A debug log records database operations, system processes, and errors that occur when you execute a transaction. The system generates a debug log for a user every time that user executes a transaction that is included in the filter criteria. The level of detail each log contains can be adjusted. Although the debug log files appear as plain text, it is difficult to interpret their raw log lines. This guide shows you how to use the Developer Console to analyze those lines effectively while performance profiling.
Workbench
Workbench is a powerful, Web-based suite of tools available from the Developer Force community. Designed for administrators and developers, this tool allows you to describe, query, manipulate, and migrate both data and metadata in salesforce.com organizations directly in their Web browser interface. Workbench also provides many advanced features for testing and troubleshooting the Force.com APIs. This guide uses Workbench to demonstrate how you can easily run queries through the API and get the information you need for performance profiling.
Architecture Developer Center
The Architecture Developer Center is a library of best practices for architecting sound implementations on the Force.com platform. On this page, you can find links to many white papers, webinars, and blog posts related to performance optimization. These resources can help learn what to look for when performance profiling your application, as well as how to apply best practices to overcome performance-related challenges. References to this content appear throughout this guide.
Performance profiling: the methodology
A typical, high-level flow of a performance profiling task would look something like this.
- Define the scope of the task. Split business scenarios into a subset of operations, functionalities or simply by pages.
- For each task, measure the performance of the application (e.g., a Visualforce page) and identify potential bottlenecks.
- Identify and fix the bottlenecks’ root causes.
- Compare results and repeat steps 1, 2 and 3 until you remove the bottlenecks or minimize their effects.
Iterate on the performance profiling steps with larger data volumes and with users who have various different sharing settings so that you can gauge performance impacts as comprehensively as possible.
Using the Debug Log and the Developer Console
To begin performance profiling on the Force.com platform, you need:
- A user who has a System Administrator profile and development mode enabled. If you don’t already have a user with that profile, ask your administrator to create one or create one yourself in your own Developer Edition organization for free.
- A non-administrator Salesforce user who will be actually using the application.
To illustrate the profiling methodology—and to avoid focusing too much on how to resolve poorly performing code—let’s look at a very simple scenario.
Note: We assume that you have already used generic Web analysis tools, such as Chrome Developer Tools, Firebug, or Fiddler to identify network issues and resource optimization opportunities.
The following basic Visualforce page displays total sales amounts and numbers of active sales orders, both of which are grouped by their opportunity StageName.
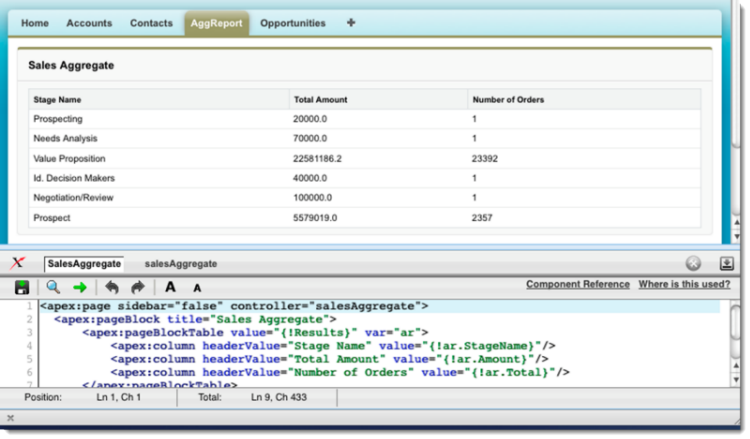
If you want to follow the steps illustrated in this guide using your own Developer Edition or sandbox organization, use the sample code below, which should work out of the box. If you are new to Visualforce, start with the Visualforce Developer Guide and the Visualforce Basics Trailhead module.
Visualforce page source
Apex controller source
Viewing Visualforce page debug logs in the Developer Console
Although you can use the Developer Console to run and debug logs of anonymous Apex, you cannot use it to directly render and collect debug logs for Visualforce pages. Before jumping to the Developer Console, you must first collect the debug information you need for performance profiling. If you have multiple Visualforce components in your page, you might want to take them apart and profile them one by one, unless they have dependencies and affect the performance of one another.
Step 1: Set up two users.
To obtain logs for your Visualforce page, you must use two users: an administrator user to set up and analyze the debug logs, and a non-administrator test user to access the Visualforce page. Have the test user set up with appropriate permissions and sharing configurations so that you can later access the Visualforce page. From a separate browser, use your administrator user to enable the debug log for your test user.
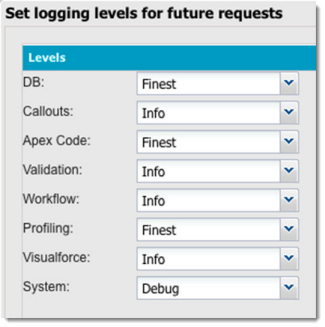
Tip: Set your debug log filter by choosing the appropriate log levels so that you can focus on areas that are related to what your application does and what you would like to profile. Here is a sample setting configuration that would work for this scenario.
Step 2: Execute your Visualforce request.
With the test user, execute the request by accessing the Visualforce page and completing any operations you want to profile.
Step 3: Open the test user’s log.
Tip: To view new logs, open the Logs, Tests, and Problem panel and click the Logs tab. Find your log and double-click the line to load the log into the Developer Console.
Step 4: Disable the debug logs.
Always stop retaining debug logs after you’ve collected the information that you need. If you leave debug logs running, they might override other important logs once you reach the organization-wide 50 MB debug log limit. Also, you can collect only up to 20 debug logs per user. Once you reach this limit, you will have to reset the debug log collection for the user.
Using the Developer Console to profile Visualforce pages
Now that you have a log to work on, start with a high-level analysis to find which part of your request is taking the longest in duration.
Tip: Set up your Developer Console by pressing CTRL+P or clicking Debug | View Log Panels, and then selecting the following panels.
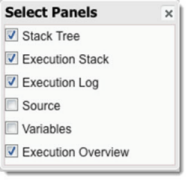
Then move the panes (panel borders) around to make the console look like the following layout. This layout will allow you to focus on the information you need for performance profiling. Click here for a quick overview of each panel.
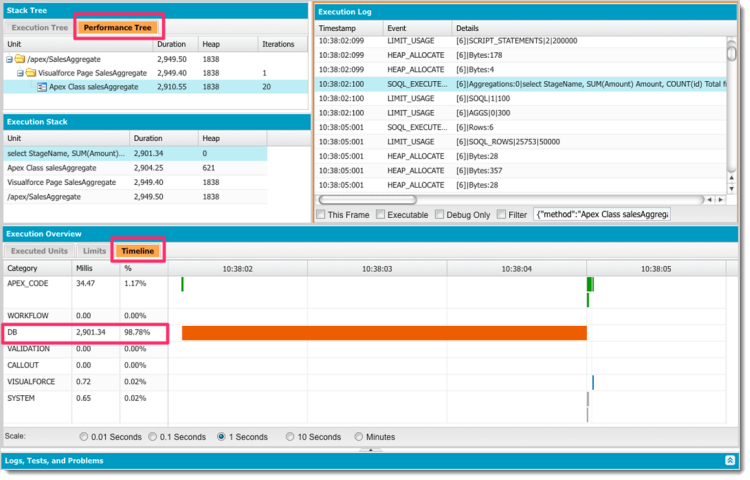
Step 1: Read the timeline of your request.
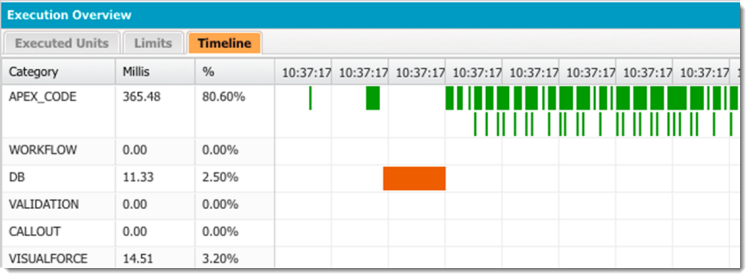
Open the Timeline chart by clicking the Timeline tab in the Execution Overview panel. This panel will give you a good visual representation of the duration of each type of the request’s transaction. For this scenario, the database query (DB) is taking the majority (2.9 seconds / 98.78%) of the total execution time.
Depending on your performance profiling case, you might see something less obvious. For example, shorter bursts of Apex events might get executed repeatedly and add up to a significant amount of the overall execution time. The following example shows how such a request would look. While the single orange bar for “DB” might initially appear to represent the bottleneck, that request is only taking up 2.5% of the overall time. You should also pay attention to the narrow green vertical lines that represent those repeated bursts, which are usually caused by inefficient Apex loop logic.
In different cases, you might also see that the Visualforce page is taking a long time to render. If you ever have this type of transaction, identify coding anti-patterns by referring to Best Practices for Improving Visualforce Performance, which has a list of Visualforce performance pitfalls that many of our customers fall into.
Step 2: Identify what the executed event is doing.
Once you’ve identified that the database event is taking a significant amount of the overall request time, the next step is to identify what this transaction is doing. Open the Execution Log panel and select “Filter” to get the information needed to identify the bottleneck(s). For this example, filter by Category to show only events related to “DB,” as shown in this screenshot.
Tip: You can customize the Execution Log panel’s columns by hovering over any of the existing columns and clicking the small pull-down icon, as shown below.
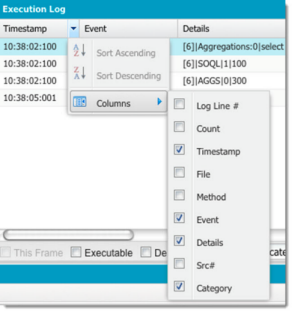
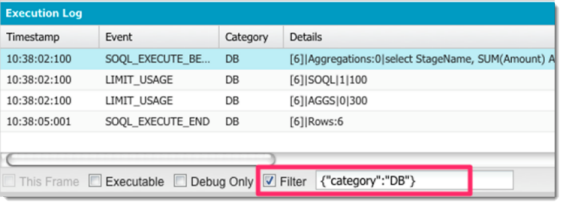
Because this example is very simple, you can see only a few log lines, the top of which shows the SOQL SELECT statement being executed, and the last of which shows the resulting row count. You have now identified a SOQL statement that needs to be reviewed and tuned.
Note: If you have multiple log lines, you can use the timestamp to identify the lines that align with the timeline you are focusing on. You can also follow the next step to evaluate the duration of each request.
Step 3: Review performance benchmarks.
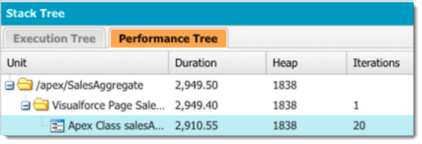
From the Stack Tree panel, click the Performance Tree tab and expand the tree. This tab will give you a breakdown of the corresponding duration in milliseconds, the heap size, and the iterations for each component executed for your request. If you have multiple units, work your way down your list, starting with the event that has the longest duration.
Tip: By clicking the unit that appears to cause the bottleneck (have the longest duration) on the Performance Tree tab, you can automatically apply a filter to the Execution Log and spot the gap in timestamps. Disable the filter and look at the events that fall in this gap.
Looking at the statistics shown in the Performance Tree, verify that they match what appears in the Execution Log. Then take a note of the duration, heap size, and number of iterations. Use these metrics as benchmarks for both the tests that you run with different conditions and the tests that you run after tuning your Visualforce code.
Step 4: Test for scale.
Repeat the same steps with larger volumes of data and with different users (e.g., a user with limited data visibility vs. an administrator with access to all data).
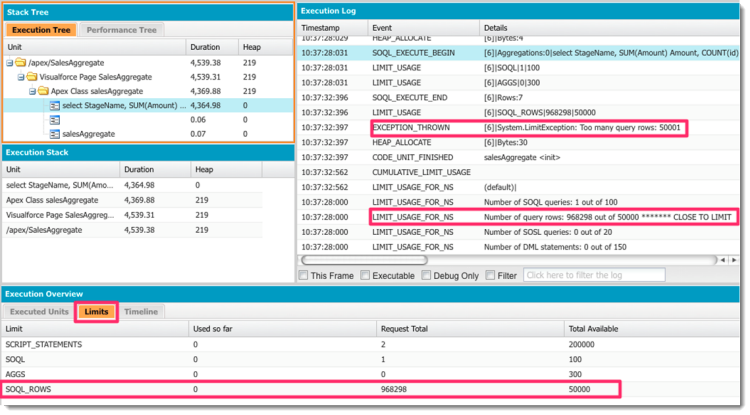
Once you start adding tens of thousands of records, you might discover that the execution duration becomes longer. (The previous sample code would eventually hit governor limits, such as “System.LimitException: Too many query rows: 50001.”) By using the Developer Console, you can inspect how close you are to hitting various Force.com governor limits—or how far over those limits you already are. The following example shows some limit-related Visualforce errors that you might receive.
Now you have discovered that you need to add logic, such as pagination or filtering, to your application to handle larger sets of data and to ultimately provide your users with good performance experience.
Using Workbench to profile data
Continuing from the previous scenario, follow these steps using Workbench to take your performance profiling a step further. Profile your dataset and assess the selectivity of the potentially unselective SOQL statement that we discovered in the previous step.
Step 5: Discover SOQL query performance issues.
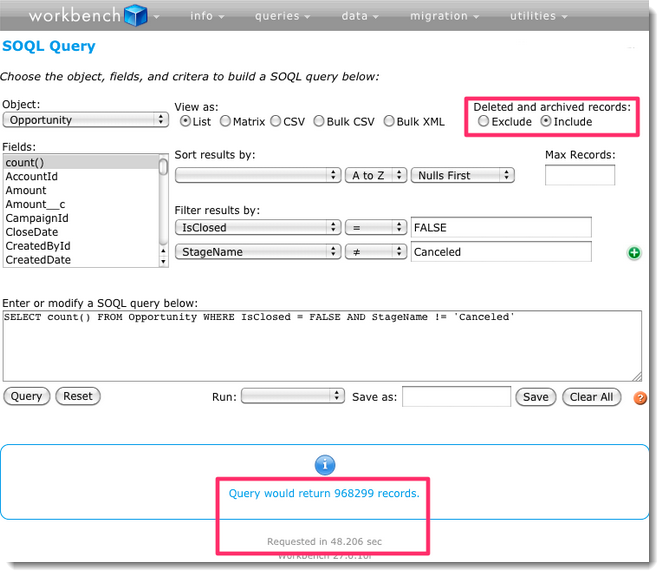
Use the “Deleted and archived records” option in Workbench and select “Include” to get an accurate representation of the objects’ total data volume. Build your SOQL statement by using the point-and-click interface or by directly entering the statement in the text area as shown below.
Look for large number of soft-deleted rows and purge them to achieve optimal query performance. (Also refer to Best Practices for Deployments with Large Data Volumes and the Large Data Volumes Trailhead module.)
Note: You can also refer to the Storage Usage menu to look at the objects’ record counts. (From Setup, click Manage Users | Users.) However, this page is processed asynchronously. If you add or delete large number of records, the change might not be immediately reflected in this page. Even more importantly, the data does not reflect soft-deleted rows. When profiling performance, including the number of soft-deleted rows in your base record count is important, as these rows can affect query performance.
Step 6: Assess the selectivity of your query.
To profile the selectivity of each filtering condition, break up your WHERE clause and run SELECT count() queries for each filter, as the figure above demonstrates. For AND operators, combine the filters and assess selectivity of your query. For OR operators, you must assess each filter’s selectivity separately. Make sure that you have indexed the selective fields, and that you are following best practices for taking full advantage of the Force.com query optimizer. If the query takes a very long time or times out, this indicates that you have a performance bottleneck. To learn more about the Force.com query optimizer, read this blog post and watch this webinar. To learn more about its selectivity thresholds, see the Database Query & Search Optimization Cheat Sheet.
Things to consider when profiling on the Force.com platform
When profiling, consider the following:
- Governor limits. Use the keyword “LIMIT_USAGE” in the Execution Log to review cumulative limit usage. Identify areas that are close to reaching limits.
- Different sharing settings. Iterate your performance profiling steps by adding users with different roles. This tactic can allow you to uncover possible performance impacts that are caused by data volume and sharing calculation overheads. You might not be able to profile these performance impacts if you run tests only using your administrator user — the system does not go through sharing-related calculations for users who already have access to all data.
- Database cache effects. The Force.com platform uses caching techniques under the hood to improve query performance. It is ideal to obtain baseline benchmarks based on requests with no cache effects, but you cannot prevent a transaction from using the cache. After completing your first profile run, also go through additional runs that are based on similar conditions and compare your results. For example, if you begin testing with user A, run your test a few times. Most likely, subsequent tests will run faster—up to a certain point. Similarly, when you switch to user B or use a different set of data, follow the same strategy and run the test a few times. While it is great to see better query performance during profile runs, don’t design your business operations and jobs based on the assumption that you will always see the best test results.
- The use of indexes. For performance profiling at the query level, you cannot determine if your SOQL request actually uses an index or not. However, you can test and see how the query performs without the index by swapping your query with a custom field that does not have any custom index on it. Once you get your query’s baseline performance, you can create an index on that custom field or switch back to the original field that has an index to evaluate the index’s effects.
- Load testing. For on-premises implementations, load testing — including stress, bandwidth, or concurrent user testing — is generally part of performance testing. On the Force.com platform, the objective of load testing is to test against Force.com governor limits. This testing might uncover issues such as hitting Apex concurrent limits because many users are simultaneously making requests that run for more than five seconds. However, using tools with unrealistic business scenarios to find server capacity boundaries is not recommended on the Force.com platform. Collecting critical information, such as server-level resource statistics, and identifying bottlenecks is not possible, and in most cases, you simply will not be able to obtain accurate results because you have reached governor limits. Before running any load tests, log a case with salesforce.com Customer Support.
Next steps
The previous profiling steps can help you identify and evaluate the performance bottlenecks of your application. It may require multiple iterations and you might also need additional help to make your application perform and scale so that it meets your business needs.
Salesforce.com Customer Support and our engineering team are equipped with tools and standard processes that can add more insight to your performance profiling. For example, if you discover that you do not see any application performance improvements even after you hard-delete your records, you might want to request salesforce.com Customer Support for a physical delete.
You can also go through salesforce.com Customer Support to reach our engineering team, who can give you a Force.com query optimizer analysis. Based on the results of the analysis, the team might suggest using selective filters and creating custom indexes. The team can also analyze database-level statistics and possible create skinny tables.
Note: To take advantage of these services, you must qualify for developer support.
Summary
Debug logs, the Developer Console, and Workbench are tools that you can use to proactively identify performance bottlenecks and compare test results. Understanding best practices for optimizing performance is important—but when you’re trying to build scalable, well-performing applications—applying those best practices in your implementation is even more important.
Related resources
- Apex Testing on Trailhead
- Developer Console Basics on Trailhead
- Developer Console documentation
- Workbench
- Best Practices for Deployments with Large Data Volumes
- Maximizing the Performance of Force.com SOQL, Reports, and List Views
- Architecture Developer Center
About the author
Daisuke Kawamoto is an Architect Evangelist within the Technical Enablement team of the salesforce.com Customer-Centric Engineering group. The team’s mission is to help customers understand how to implement technically sound salesforce.com solutions. Check out all of our resources on the Architecture Developer Center.