Dashboards help users answer a handful of predetermined questions, usually limited by data from a single source. Apps empower users to ask and answer their own questions from all of their interconnected data; making informed decisions and taking action. This blog post walks through how to create Einstein Analytics apps.
Analytical apps bring together all of your data.
With steps, Einstein Analytics treats data as data, ready to be visualized by any widget and interact with any other step through bindings.
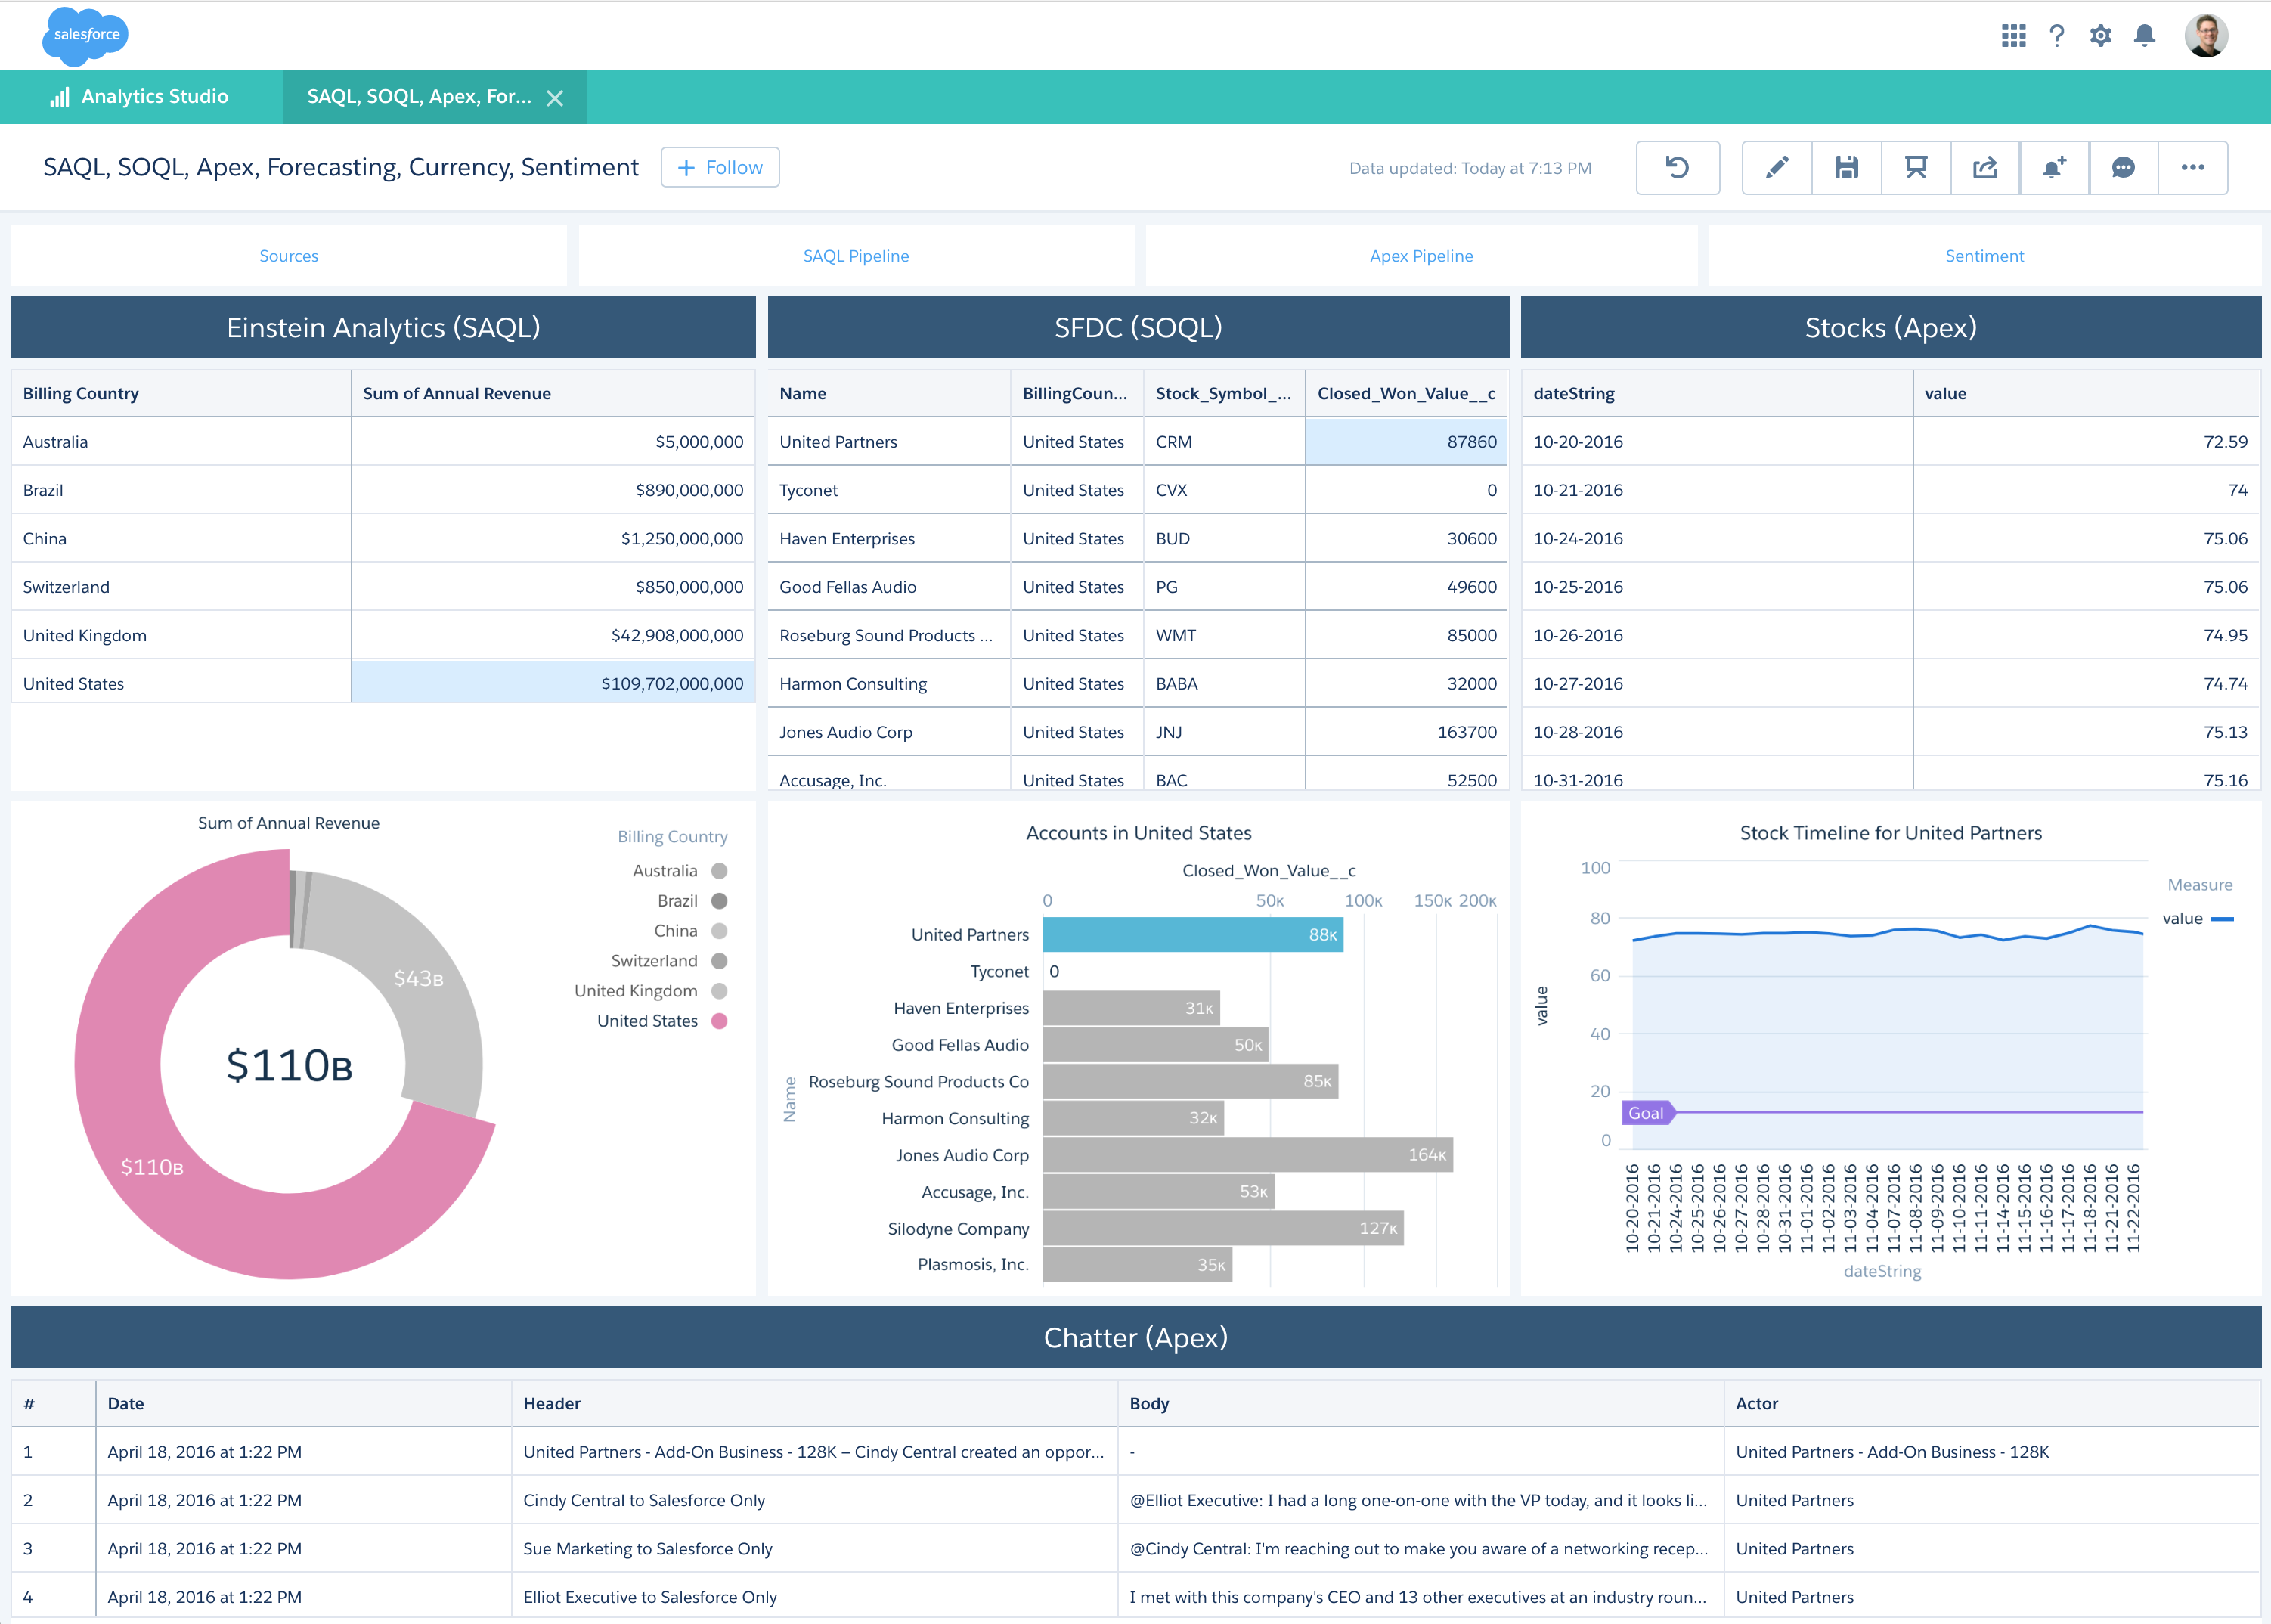
- SAQL step used to aggregate annual revenue of all accounts by country.
- SOQL step used to pull individual accounts in a country with most recent changes like closed won.
- Apex steps used to pull live stock quotes and chatter feeds for selected account.
Each source is used for what it does best – macro aggregations across all records, grain level system of record, and streaming direct APIs – all interconnected with bindings.
Einstein Analytics allows users to query millions of rows of data in sub-seconds through SAQL. It performs extremely well at ad hoc segmentation, aggregation, and filtering, making it ideal for historical and exploratory analytics. However, this is achieved through ETL and wide denormalized tables, trading real-time changes and full relational joins for performance.
The Salesforce platform allows for real-time, system of record relational queries through SOQL. Data is queried directly, changes available instantly, and variety of relationships (lookup, master-detail, and many-to-many) built fundamentally into the system. Like with Einstein Analytics though, this comes at a cost. Instead of millions, SOQL is more comfortable with hundreds or thousands of records. With the SOQL step, you can also directly query remote databases with OData, without going through ETL, if the constraints of those target systems meet the needs of your app.
Then there’s a multitude of datasources accessible within and beyond Salesforce via APIs. Social feeds with Chatter or Twitter, streaming stock quotes or weather reports, and queryable sources such as BigQuery or Redshift. All can provide significant and interesting signals for your app wherever that data might live. Much of this can be brought into Einstein Analytics through ETL, but depending on how the data is queried and presented, it might be better used directly.
The same data can be in multiple sources, but each source has its unique tradeoffs so a combination of them used in the right circumstances is required for the most compelling and performant apps. Steps allow us to integrate and treat all data, regardless of the source, uniformly. Einstein Analytics datasets are brought in by saql, aggregate, and grain steps; Salesforce records are brought in by soql steps; inline data embedded in static steps, and everything else via apex steps.
Analytical apps use the power of the platform.
Allowing users to bring in all of their data directly into a single Einstein Analytics app was just the first step. Integrated with the broader Salesforce platform and coupled with our bindings engine, users can build reusable and packageable controllers for any data integration or processing, making them as easy to apply as Snapchat filters. Puppy face for my data, yes please!
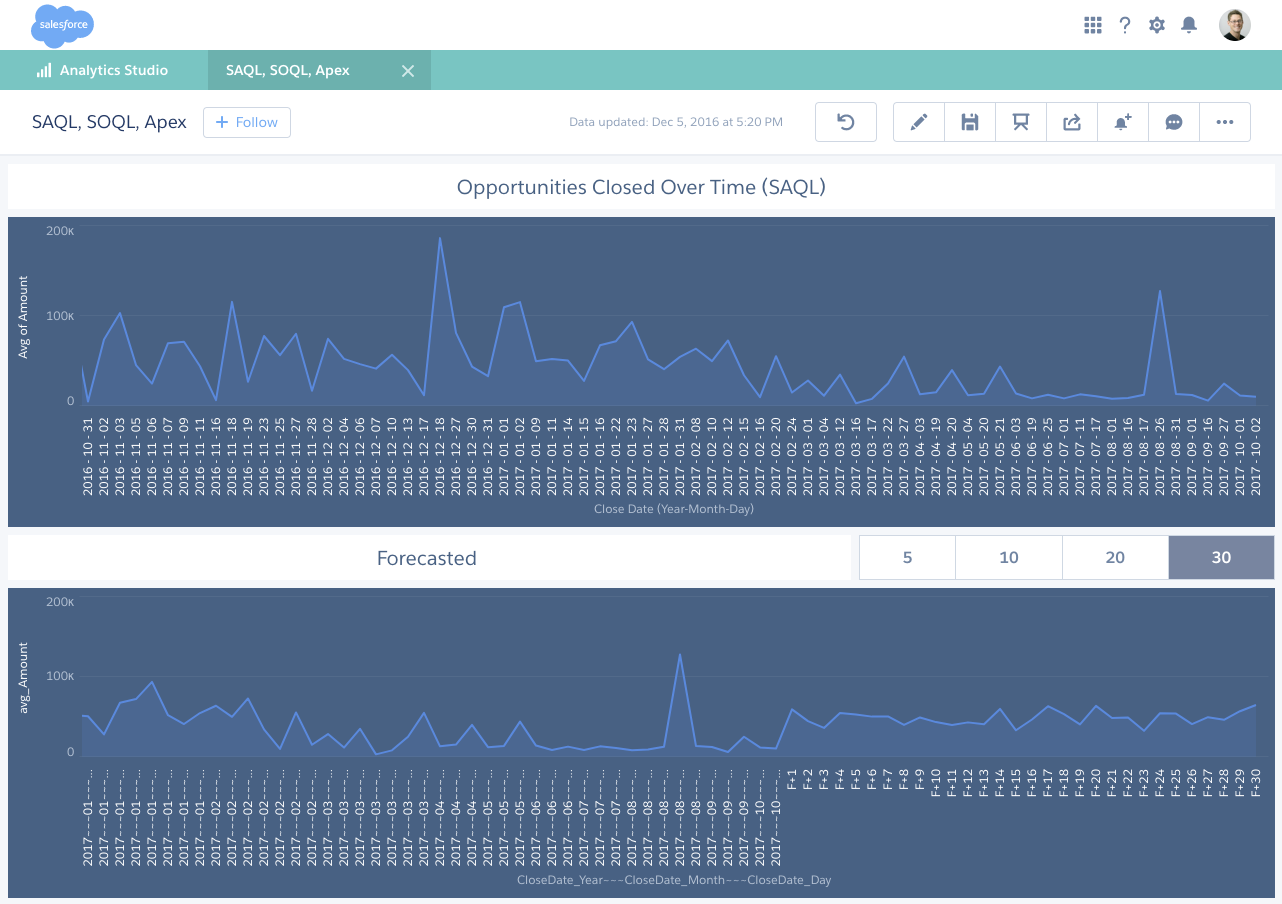
Forecasting the average amount of opportunities closed, originally queried with SAQL, 30 days into the future, we use a hosted Algorithmia API wrapped in Apex (make sure you check the security and data policies for any connected API since you might be sending sensitive data to them). Using Einstein Analytics results bindings we can pipe the results of any other step into the forecasting step with a configurable number of iterations from a static step and selection bindings.
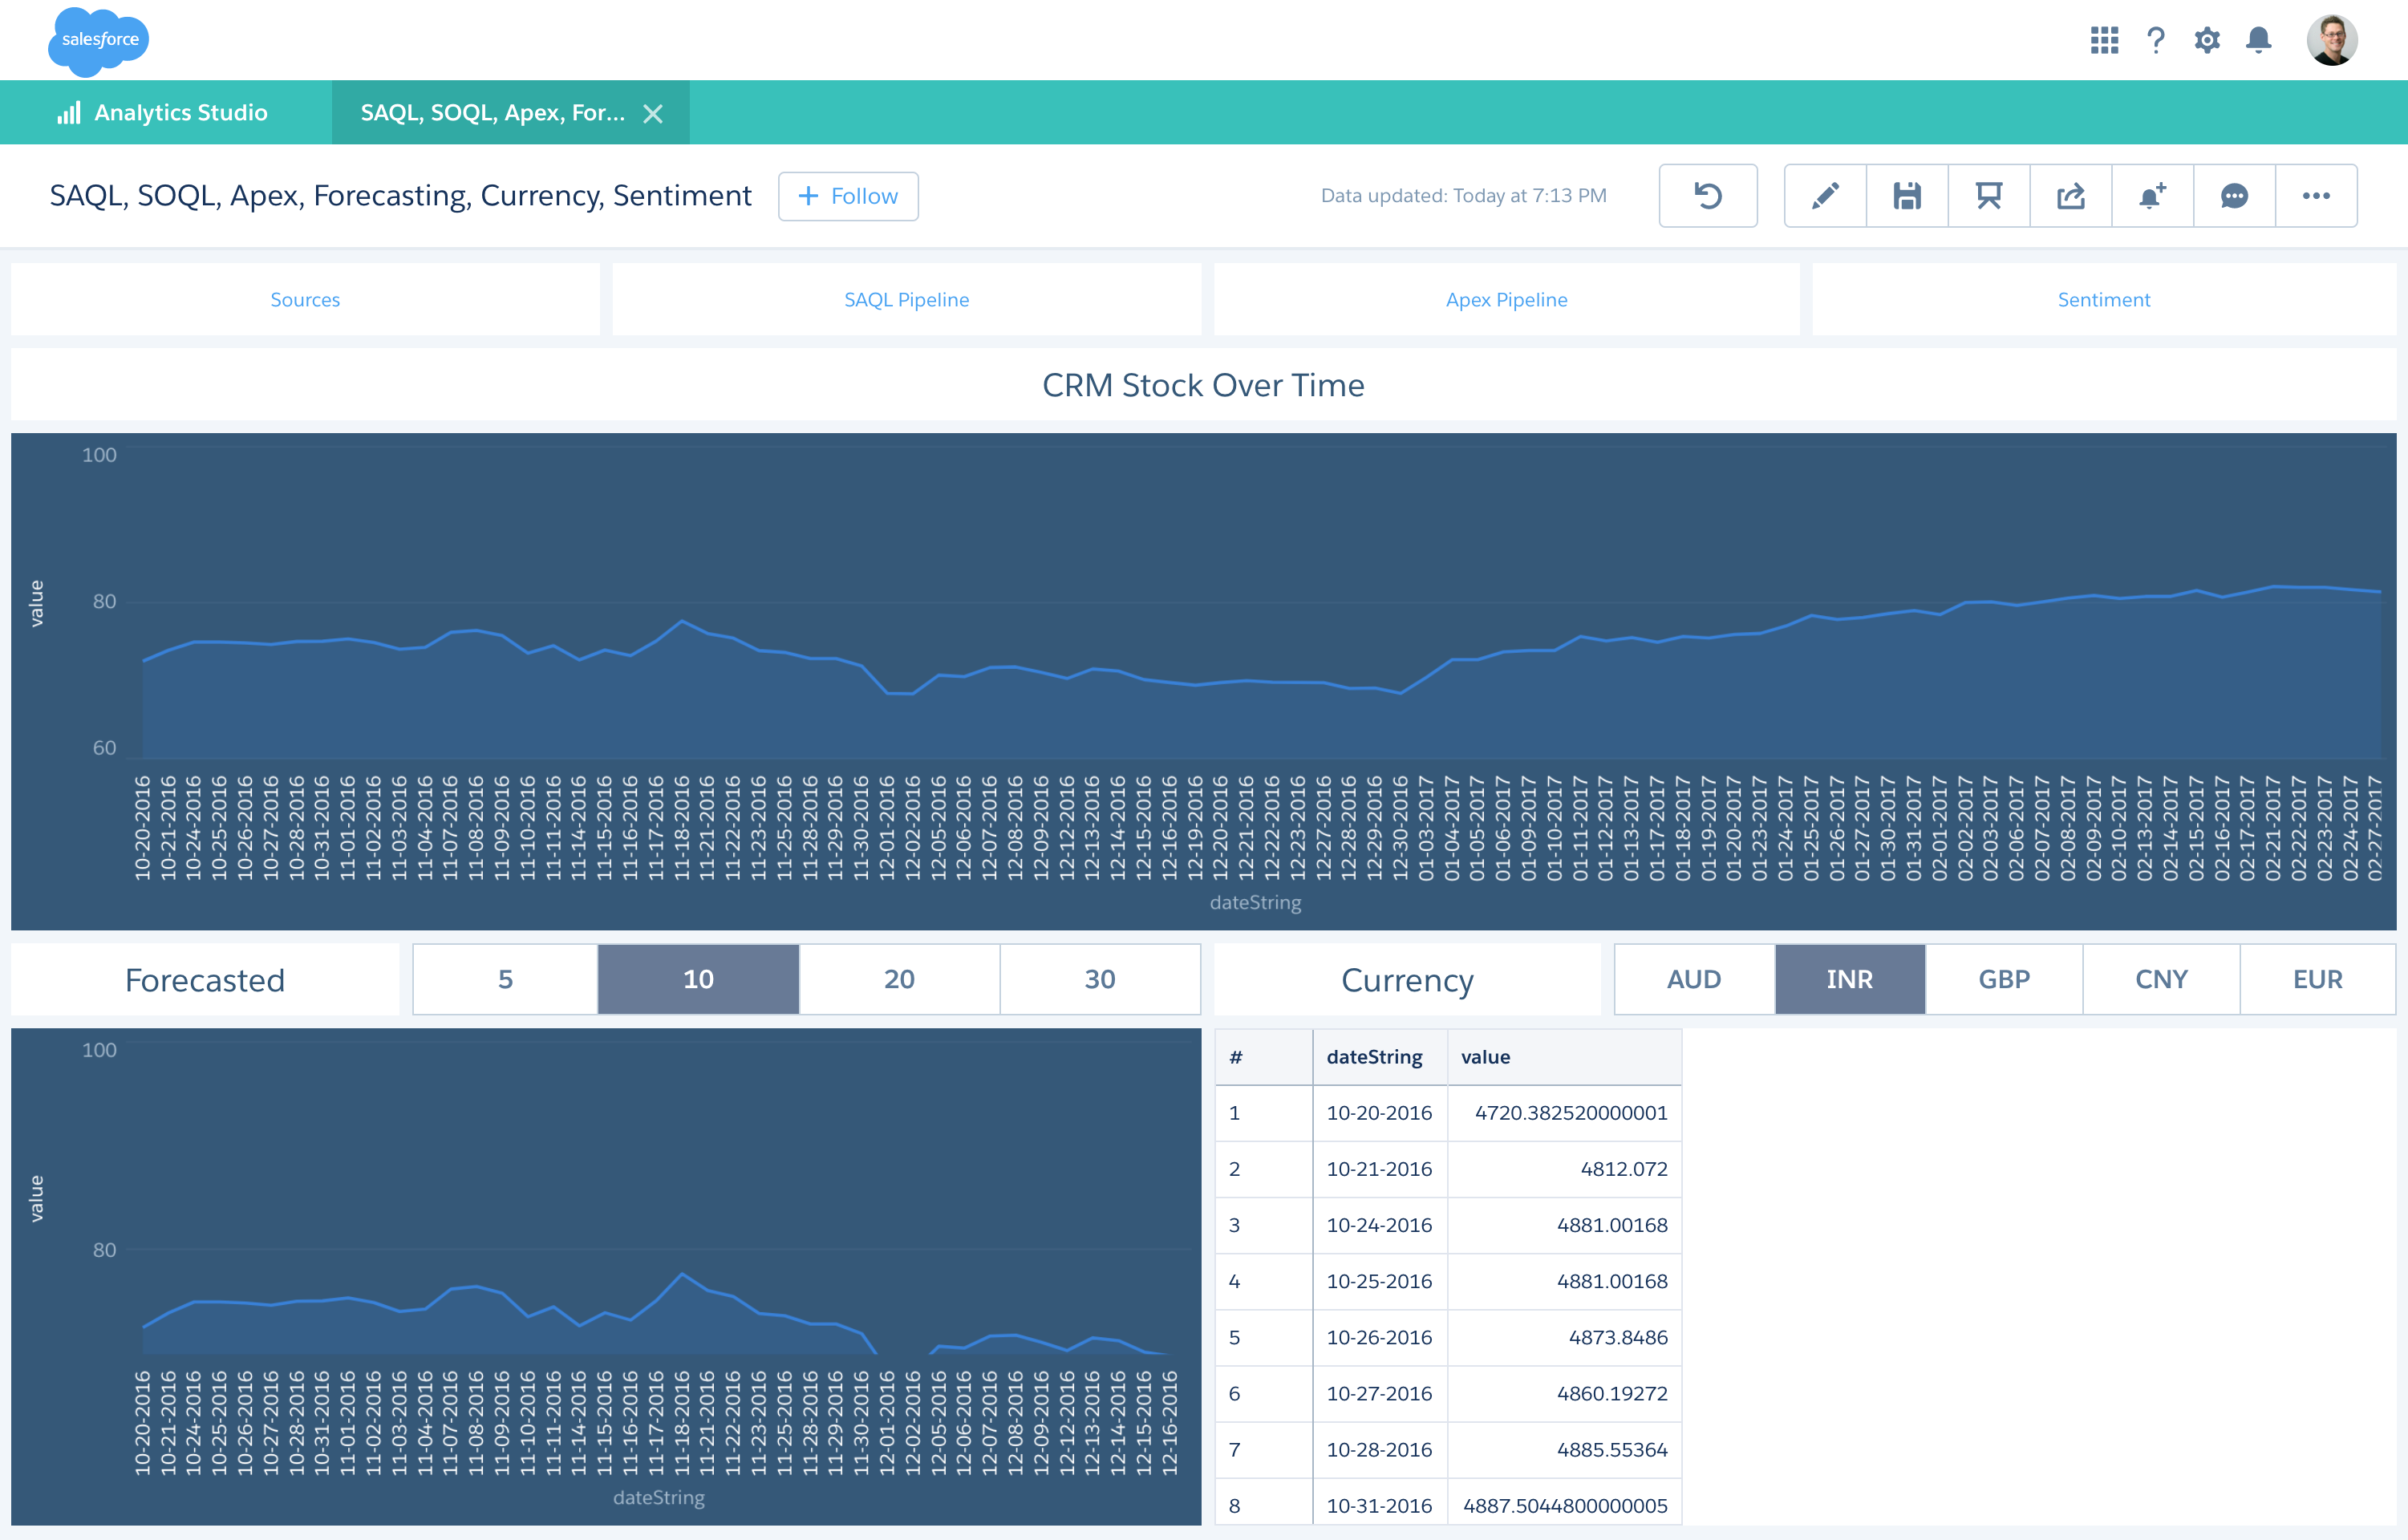
We can keep chaining more Apex steps to further process, refine and augment our data. Reusing the forecasting step but with CRM stock prices we then pipe the results into another step to also apply live currency conversions.

Leveraging the breadth of hosted algorithmson Algorithmia we can even apply sentiment analysis to a Chatter feed or data set of presidential election tweets.
However, one of the most powerful features might be leveraging Apex and its access to the user context to create contextual steps that presents each user with different data and visualizations during different conditions like time of day, location, or last interaction. With persistence in SOQL, steps can even have a memory and maintain state for later use.

Built data agnostic, the Einstein Analytics platform also broadly enables other features like performance profiling, sharing to Chatter, and CSV export for all step types.
Demo
What’s next?
The Einstein Analytics platform has grown to a point where our engineers are using it to build the next generation of Salesforce BI and analytical apps from Operational Report Builder to Einstein Explorer and Discovery. With this you can expect to see even closer integrations and deeper insights for more of your data.
So dump the traditional dashboard and get ready to connect all of your data, regardless of where it lives, with rich contextual interactions and processed through the next generation of machine learning. With analytics apps, you can expose actionable insights all inside of Einstein Analytics.
If you want more information, please please check out these resources:
About the author
Zuye Zheng is a software architect for Einstein Analytics, working on products to help users interact and get more out of all their data.