Salesforce Extensions for VS Code ships every week with bug fixes and updates. This post discusses a few of the major updates that have been released recently.
Apex Replay Debugger preview
You may have seen the exciting news at TrailheaDX that we are launching a log-based replay debugger as part of Salesforce Extensions for VS Code. Apex Replay Debugger brings Apex debugging to the Salesforce platform for everyone. The debugger is now available as a preview and is (and will always be) FREE for everyone to use. Finally, right?
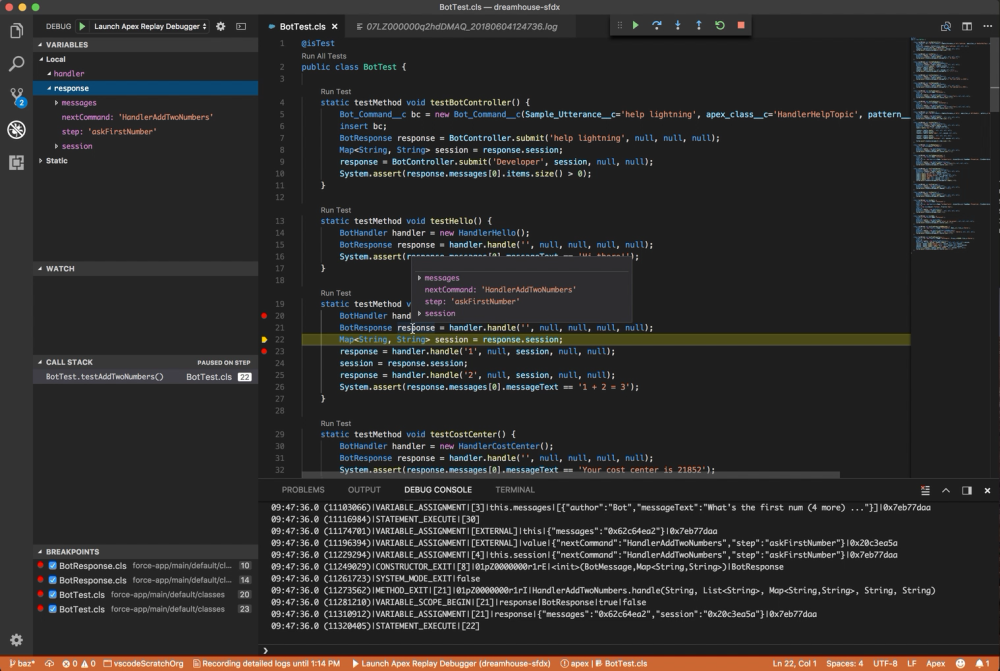
Apex Replay Debugger makes it easier than ever to solve problems with your Apex code. Running the replay debugger gives you the same features you expect from other debuggers. You can view variables, set breakpoints, and hover over variables to see their current value. The replay debugger can be used from logs generated by running tests or for debugging interactive or non-interactive code and can be downloaded and run right from VS Code.
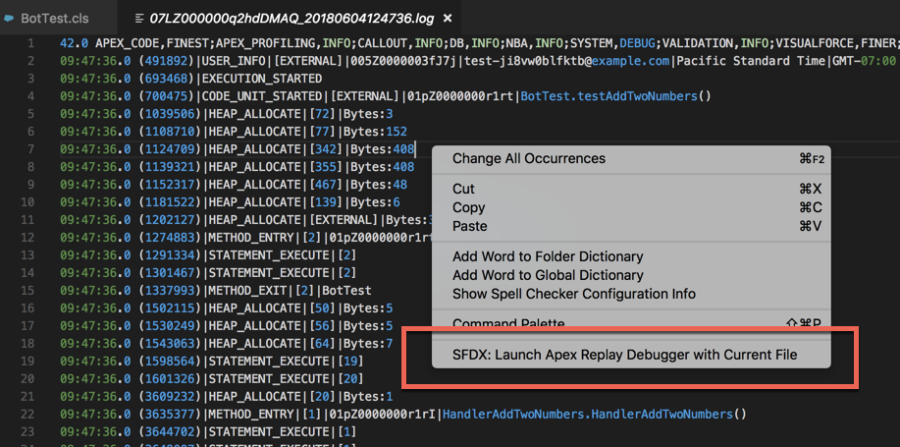
Apex Replay Debugger also makes it easy to work asynchronously and collaborate with others to solve problems. Because you can launch a replay debugger session from any replay-enabled log file, clients and coworkers can share logs to help solve problems. To start a debugging session simply open a log file and right-click to launch the debugger. For details, check out our docs in the Visual Studio Code Marketplace.
If you just want to jump in and start using Apex Replay Debugger, go download it now.
ISV Customer Debugger
For ISVs, debugging can be a pain. You are allowed to debug your code, your customer is allowed to debug their code, but sometimes you need to debug all the code in order to track down a problem. ISV Customer Debugger has existed for a while in the previous IDE, but now you can use the ISV debugger right from Visual Studio Code. For more information, see the “ISV Customer Debugger” section of the Apex Debugger documentation.
Apex syntax highlighting improvements
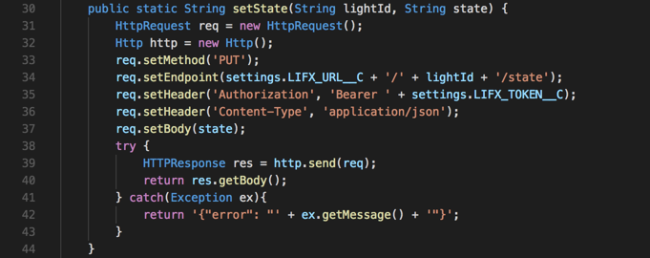
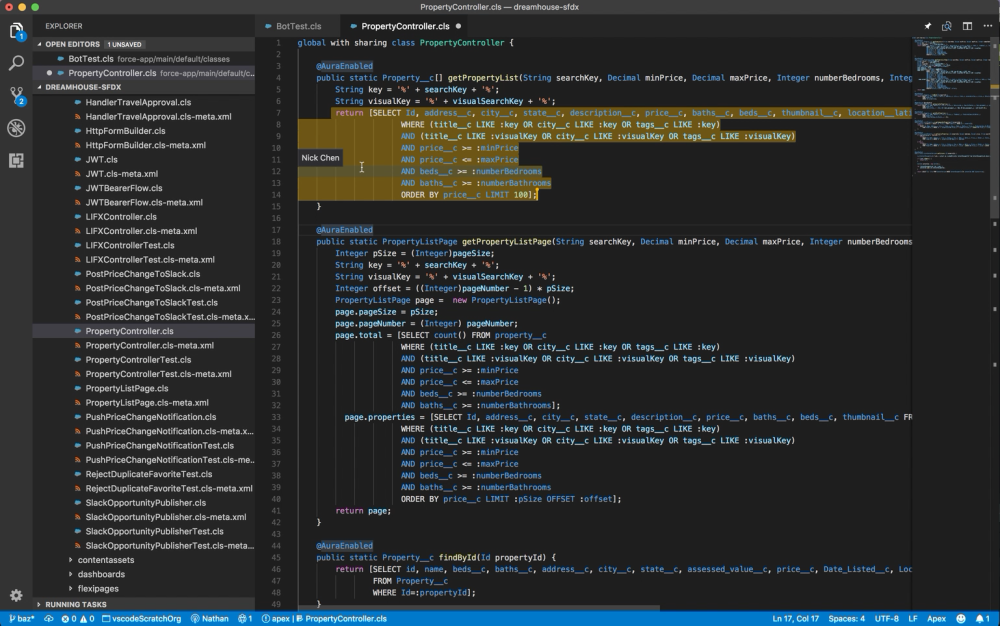
You may have noticed that your Apex code looks a little bit nicer. We have been working to improve syntax highlighting for Apex to properly colorize all elements and SOQL queries. We aren’t finished yet, but you should see some big improvements. We open sourced the official Apex Text Mate Grammar so that it can be used in other IDEs and, if so inclined, people can contribute pull requests. Additionally, the grammar is published as a node module. In both locations, you will find the grammar file in the TextMate XML format and the Atom CSON format.
Apex syntax highlighting in VS Code respects your theme as well, so if you want to make customizations to how your Apex looks you can easily do so. Below you can see how the Apex code now looks with the default VS Code dark theme.
Visual Studio Live Share
Finally, I wanted to point out a new feature that — while not exclusive for Salesforce developers — is a really great enhancement to the Salesforce developer’s toolset. Several weeks ago, Microsoft released Visual Studio Live Share. Live Share allows you to share your Visual Studio Code session with other developers using Visual Studio Code and collaborate together. Using Live Share, you and a team member working in two locations could write some Apex, run tests, and use the replay debugger together to solve a problem. You can download the Live Share extension and try it out today with your fellow Trailblazers.
Thanks for reading and using the Salesforce Extensions for VS Code. Please let us know if you have any questions, feedback, or comments.
To supplement your use of Salesforce Extensions for VS Code, check out the Getting Started with Salesforce DX Trail on Trailhead.