With Winter ‘19, we have exposed Experienced Page Time (EPT) to everyone on the Salesforce Platform. This EPT metric, better understood as Page Load time, can be explored through the Lightning Usage App which highlights the performance at both a browser and page level. This blog post is going to help you understand how we define and calculate EPT.
Lightning Usage App
The Lightning Usage App is a new way to track adoption and usage of Lightning Experience so you can monitor progress and make informed decisions. With insights like daily active users, the number of users switching to Salesforce Classic per day, and the most visited pages in Lightning Experience, you can better understand your users’ needs and focus on the issues that really matter.
The app is available right from Lightning Experience. Simply click the App Launcher icon in the navigation bar, type Usage in the search box, then click Lightning Usage. In the app, you can click tabs in the ACTIVITY or USAGE sections on the left side of the page to view the associated data.
In the graph featured below, we are able to see the performance metrics for an example org leveraging the Lightning Usage App. This graph will vary from org to org as it is tailored to you. In this particular org, we can see that there was a spike in Android use in June and that Salesforce Mobile has the least EPT overall.

A view of the Browser Performance tab of the Lightning Usage App
In our next graph, we can quickly view the performance of our most viewed pages. We can see that in this org, Feed Items tend to load really fast, as well as Chatter.
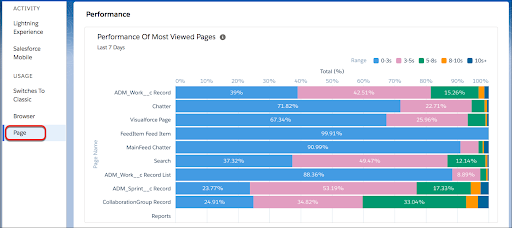
A view of the Page Performance tab of the Lightning Usage App
Defining EPT
EPT is a performance metric Salesforce uses in Lightning to measure page load time. The idea behind this metric is to time how long it takes for a page to load so it’s in a “usable state” for a user to meaningfully interact with it.
The base definition of EPT may be simple, but a lot of things can affect it. We’ll explain more in the next section.
How do we calculate that?
A major difference between Salesforce Classic and Lightning Experience is that pages load progressively in Lightning, while pages in Classic are generated on request by the server. Due to the progressive loading from the client (that any loaded component in the page might arbitrarily load more sub-components at any point in time), measuring when a page has “finished” loading is not straightforward. Since EPT is the page load time that the end users experience, a lot of factors can come into play in calculating the value.
For instance, component implementation details, errors, and caching can all negatively impact EPT. There are also external factors like network quality, browser performance, and user interactions with the page while it’s loading.
Some other things to consider:
- Lightning UI is rendered client-side and hence is sensitive to browser performance.
- Lightning UI requires many XHRs to render a page and hence is sensitive to network latency.
- Complex pages with many custom fields and components will slow down the rendering of a page.
It’s not possible for us to consider all the external and internal factors that can impact the page performance and it’s beyond our control, so we use the following method to calculate the EPT:
The EPT is measured as the time from the PageStart on which no more activity has occurred for at least two frames (~33ms). The reason behind the need of two extra frames is to avoid false positives due to asynchronous calls. This includes any XHR activity, any storage activity or any user interaction or client-side work of any kind in the main JS thread.
What’s next?
As we can see, calculation of EPT is not as straightforward as it seems and there are a lot of factors that impact it. There are certain ways with which the EPT can be impacted in a positive way e.g. using profile-based layouts, hiding contents behind tabs, being on the lookout for some anomalies in network topologies, etc. Watch out for this space for an article on how to take steps to improve EPT.
Want to learn move your app to Lightning? Check out the Improve Your Classic App by Moving It to Lightning Experience trail on Trailhead.
About the author
Venkat Narayan is a Senior Manager with the Product Management Instrumentation team. He and his team build products that empower our customers to measure what is critical to their application.