You built your first Lightning web component, everything looks great in the IDE, but something is not working as expected in your Salesforce org. That’s the point where it’s important to know how you can debug Lightning web components. This blog post will show you the available techniques.
Lightning web components in production mode
Before we look into debugging, it’s important to understand how we serve Lightning Web Components to the browser in what we call production mode and what utilities you have at hand for them. That mode is what you experience out of the box when a user uses Salesforce. It provides you two things when it comes to Lightning Web Components:
- Minified JavaScript
- Proxied values
While it’s not related to debugging, it’s also noteworthy that we ship heavy JavaScript transformations for older browsers, like IE11. That way you can use modern JavaScript and actually don’t have to care what browser your users are using.
Minified JavaScript
Minification means that we compress JavaScript into as few bytes as possible by removing any unnecessary characters and elements like line breaks, whitespace, tabs, code comments and so forth. This reduces the overall traffic that’s required for sending a file to a browser. Minifaction also changes the names of functions or variables, for example const mySuperVariable can become const d . Every Lightning Web Component JavaScript file that your browser receives from Salesforce in production mode is minified.
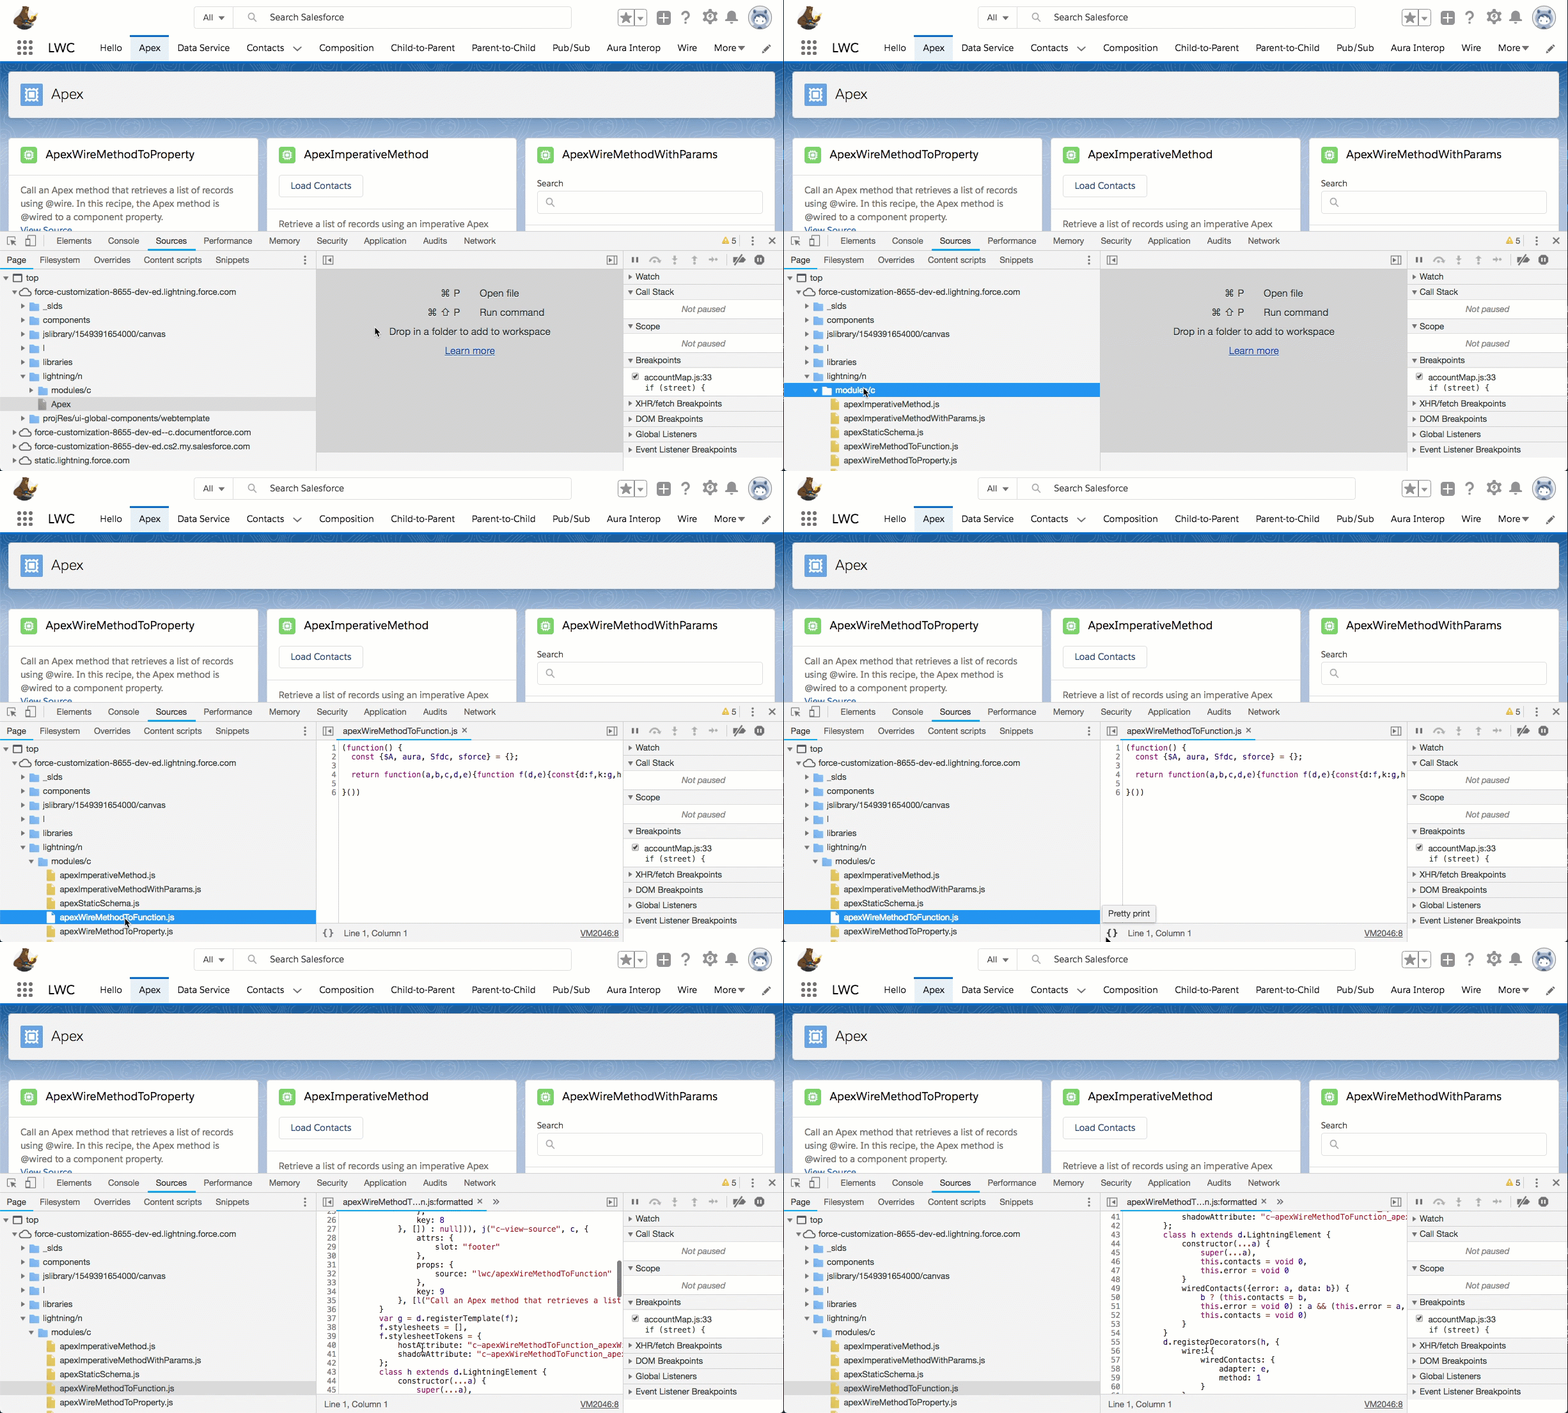
Without any special setting, you can use the pretty format option in Chrome DevTools (or similar counterpart in your preferred browser) to get some sort of code formatting. This doesn’t give you full readability because of the changed names of variables and functions, but it’s pretty decent for a first check. This code is already debuggable, which means you can set breakpoints, inspect values during runtime, and use Chrome DevTools to work with the debugged values.

Note, that you see in the GIF already the location of custom Lightning web components in the Source tab – it’s modules (compared to components for Aura components).
Proxied values
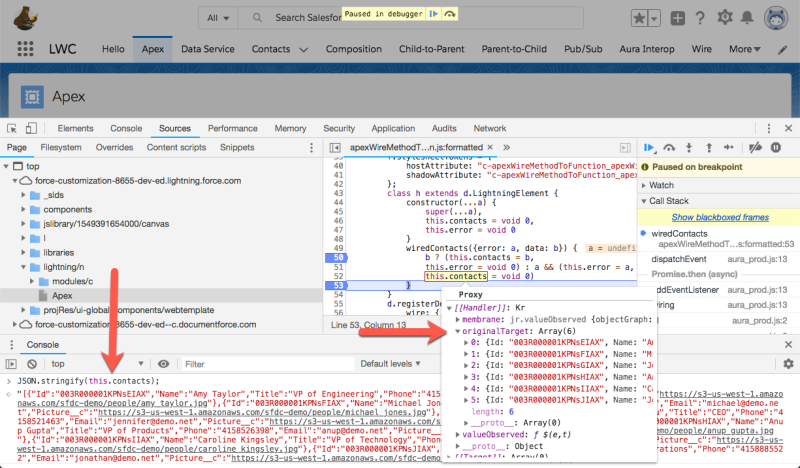
Next, we proxy certain things, like data that is provisioned via decorators (@api, @track, @wire). Some of that is to be considered read-only, like @api and @wire decorated properties. By using JavaScript Proxies we make sure that they stay read-only. And for @track decorated properties, we use proxies to observe data mutation. This also means that you only see the Proxy object and you either have to use something like JSON.stringify() in Chrome DevTools (note: if you have an Object with circular references, it’ll throw when stringified), or you have to inspect the object structure itself.

Now, you already get some good debugging information in production mode. But what if you want the real cool stuff? Let’s take a look at that.
Lightning web components in debug mode
Besides production mode, you can enable debug mode for specific users. Debug mode gives you a few things, and particularly a few things that were not available previously for Aura components:
- Unminified JavaScript
- Custom formatting
- Developer mode console warnings
You can read more about debug mode and how to enable it for users in the Lightning Web Components documentation. You can also use Salesforce CLI to create a new user in a scratch org with debug mode enabled using this command:
More information on how to use the force:user:create command can be found in the documentation.
Unminified JavaScript
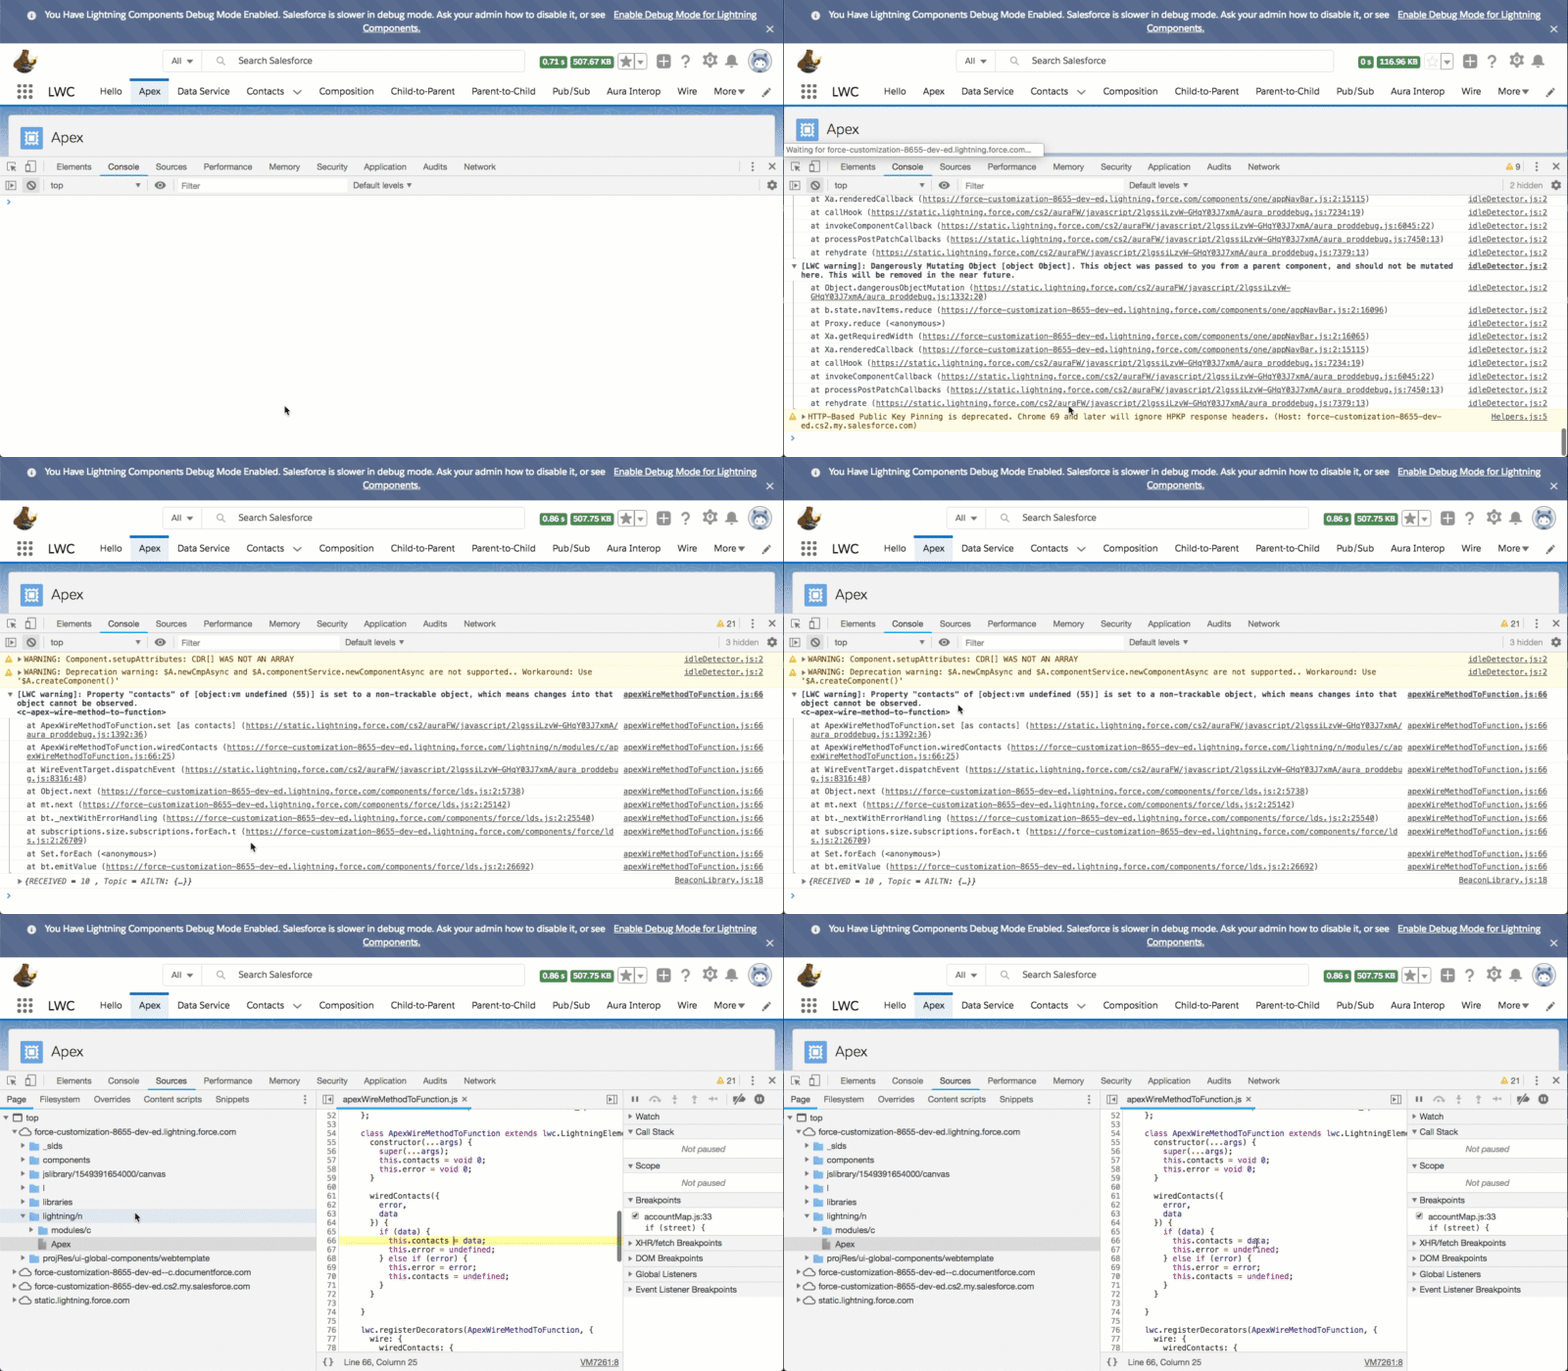
Real exciting is that we ship unminified JavaScript in debug mode. What you get in the browser is what you coded (at least in JavaScript + CSS). The mapping from what’s in your IDE to browser is close to 1:1. That’s pretty cool, right? Especially in longer JavaScript classes you don’t have to guess, or remember, what variable d was again — you’ll now see the name as it lives in your source code. And you can debug it, like you can do with minified JavaScript.
 Note that the JavaScript file in the browser also includes additional code, like transformed decorators or relative imports that got rolled up. Check out the video at the bottom to see more.
A tip on debugging data that you receive via decorated properties (@api or @wire): if you bind the decorator to a property you won’t currently be able to debug it. In case you see some behavior that you need to debug, change the property to a function (for @wire) or to a setter (for @api). Then you can debug based on the deconstructed data and error property.
Custom formatting
As you recall from the previous section, we’re using JavaScript proxies to enforce that certain types of data are read-only. To simplify the readability for you, we’re shipping a custom formatter in debug mode for these proxies. That means you won’t see the proxy object in Chrome, but instead the real value. We’re basically unwrapping the visual aspect of the proxy (but it’s still proxied, so no chance to modify the data, ok?!).
 Custom formatters aren’t enabled by default in Chrome, so you’ll need to set Chrome DevTools => Settings => Enable custom formatters.
Console engine warnings
The third feature we’re shipping for helping you to better debug your Lightning web components are “LWC engine” warnings. In debug mode the Lightning Web Components engine actually identifies bad patterns that are only detectable during runtime, and then prints them as console warnings.

It’s a best practice to develop your Lightning web components in an org using debug mode. That way you see if your code can be even more improved while you develop.
There’s one caveat at the time of this writing: you’ll likely see other console warnings from the LWC engine on the console, as we with the initial release don’t filter on your own namespace. Because of that, you see other warnings for things like base Lightning components. Also note that in the current version of the filter in Chrome DevTools has no effect on the logged warnings themselves. Some of the warning messages are also obsolete and will be removed soon, like Property “xyz” of [object] is set to a non-trackable object, which means changes into that object cannot be observed (meaning you don’t have to care about that at the moment). And yes, we’ll improve that in the next few months (#safeharbor).
The best way to actually filter for only your own components is to remove the “info” log level which hides the stack traces.
Pausing on caught exceptions
This doesn’t mean that you should take a break when your code hits an exception (although sometimes it’s the right thing to do). This means that you can — and should — leverage the functionality in your browser to pause JavaScript execution when an error is caught.
When having this feature activated, you’ll find yourself in the situation that your browser will also halt on any exceptions that are not caused by your own code, but by ours. In that case, we recommend that you make use of blackboxing, which is a feature available in Chrome and Firefox. Blackboxing allows you to define JavaScript files to be excluded from pausing, so you will only pause on your own exceptions.
Chrome allows to set regular expressions for blackboxed scripts. Using these two patterns (which you can add via Chrome DevTools => Settings => Blackboxing), you will exclude most of JavaScript errors that may be surfaced by other (read: not yours) components.
/aura_prod.*.js$
/components/.*.js$
Check out the video walkthrough
All the information of this blog post is also available as a short walkthrough video in our newly launched Lightning Web Components Video Gallery.
Summary
Lightning Web Components are not only based on modern web standards: they are also debuggable using standard tooling. While production mode gives you good capabilities for peeking into potential issues, the new and enriched functionality for debug mode makes the experience better. In one of the next releases (#safeharbor), we’ll iterate over the experience and will add new functionality like JavaScript source maps to make debugging even easier.
If you want to learn more about how to use the Chrome DevTools, check out the documentation. This website also contains a lot of useful tips to make you even more productive with Chrome DevTools. Once you’re ramped up, you should try your newly gained knowledge by deploying one of the Lightning Web Components apps from the Trailhead Sample Gallery.
Another important element that we haven’t yet discussed is how to actually unit test your Lightning Web Components functionality before you deploy them, so that you may not have to debug your code at all. We’ll cover that in an upcoming blog post.
About the author
René Winkelmeyer works as Principal Developer Evangelist at Salesforce. He focuses on enterprise integrations, Lightning, and all the other cool stuff that you can do with the Salesforce Platform. You can follow him on Twitter @muenzpraeger.