A lot has changed with Salesforce developer tooling over the past few years. As I mentioned at TrailheaDX a few months back, we have shipped hundreds of releases of our developer tools since they were first released less than three years ago. If you haven’t tried out the Salesforce Extensions for Visual Studio Code in a while, it might be a good time to jump back in. In this post, I’ll share some of the latest updates to the VS Code tools as well as some updates on other Salesforce IDEs.
Develop against any org
Many of you may not have realized, but you can use VS Code to work against all orgs – not just scratch orgs. You can develop against your sandboxes or DE orgs just as you have always done with other tools. In the past year we have released many features that make this experience great.
Org management
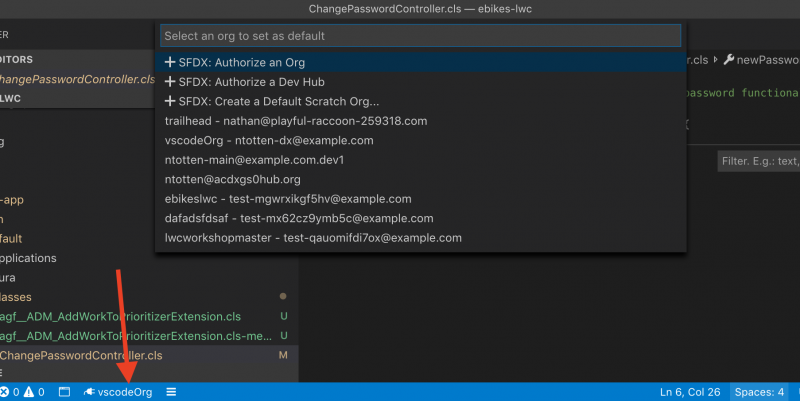
Several releases back we introduced UI for authorizing, creating, and switching orgs in your project. This makes it easier for you to work with multiple orgs on the same project or quickly create a scratch org to test a new feature. Simply click on the Org Browser button in the menu bar (shown with the red arrow) and you will see the menu for the various org actions.
Deploy On Save
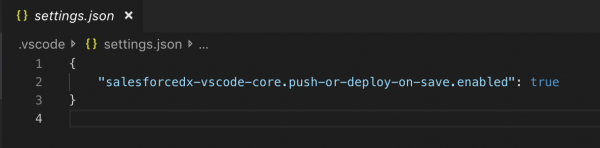
Many developers prefer to have their work save immediately to their org instead of doing deployments at various stages. This can be helpful when working on UI components where you need to test out various styling changes or behaviors or while you are trying to debug some behavior in an Apex class. Enabling Deploy on Save in your project is straightforward: simply update your .vscode/settings.json file with the config "salesforcedx-vscode-core.push-or-deploy-on-save.enabled": true. Going forward, when you save a file it will be automatically deployed to the org. It will also queue up deployments in case a deployment is currently running and batch the next deployment if multiple saves have occurred before the current deployment.
Org Browser
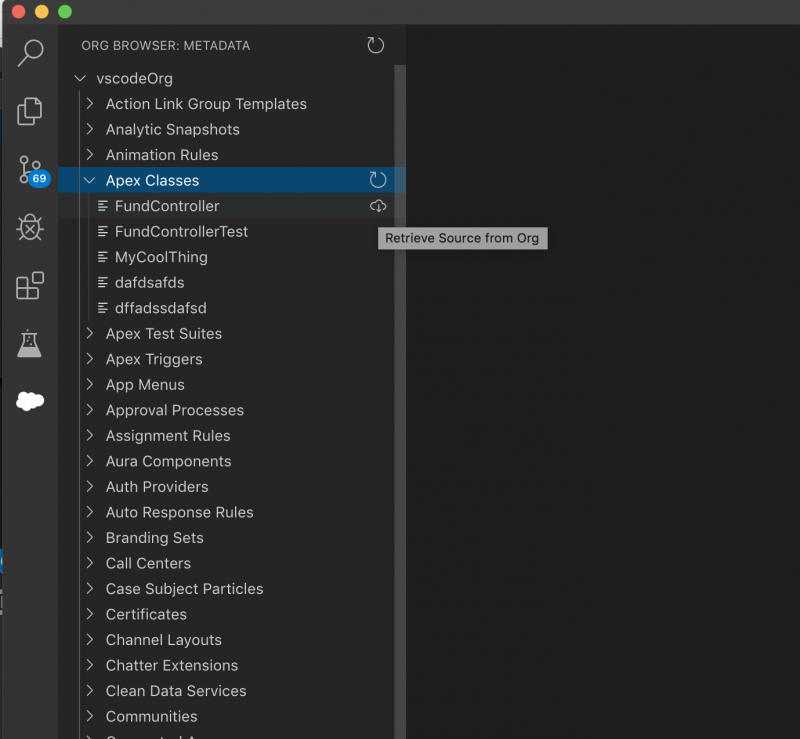
When working directly against your org you need a way to retrieve the metadata you are working with. You have always been able to use the CLI or do a retrieve if you have a package.xml file, but there hasn’t been a way to retrieve metadata from the UI in Visual Studio Code. I am happy to share that as of today, you can now use the Org Browser tab to browse and retrieve metadata from your org. Once enabled, you can browse through all the metadata in your org and click on the button next to each metadata item to retrieve the source locally. This is just the first release and we will continue to enhance this feature with more capabilities such as the ability to retrieve all metadata of the same type or create a package.xml file. Let us know what you think by commenting on this Github Issue or creating a new issue if you encounter a bug.
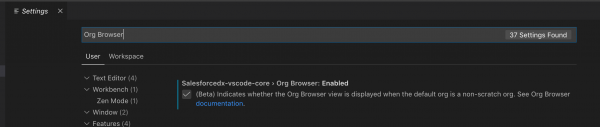
NOTE: To enable this feature you need to go to the VS Code settings and enable Org Browser. Also, for now this feature only works against non-scratch orgs – it will automatically hide when you are authenticated against scratch orgs.
Diff against org
It is often the case in your development process that you need to understand what has changed in an org or with your local code. This could be because you are working against multiple orgs that are at different stages in the release cycle or that you make changes to metadata in the org UI while also doing work on your local machine. In order to better understand where changes have occurred, we are introducing the ability to diff source changes against your org. Initially, this feature will work with Lightning Web Components, Aura, Apex, and Visualforce files, but we will expand to more metadata over time. Additionally, in the first preview release you will only be able to diff single files, but that is something we hope to improve later on as well. This feature will be released in the next week or two, so keep an eye out.
Lightning Web Components
Visual Studio Code is already the most popular editor amongst web developers today. Developers love it because it offers a rich set of features such as code completion, refactoring, and more that make writing HTML, Javascript, and CSS enjoyable and productive. In addition to the built-in features that make VS Code amazing, there are hundreds of great extensions available from the community that will let you tailor VS Code to meet your exact needs. Finally, Salesforce ships an extension specifically for LWC development that adds many great features specific to developing LWC on the Salesforce Platform.
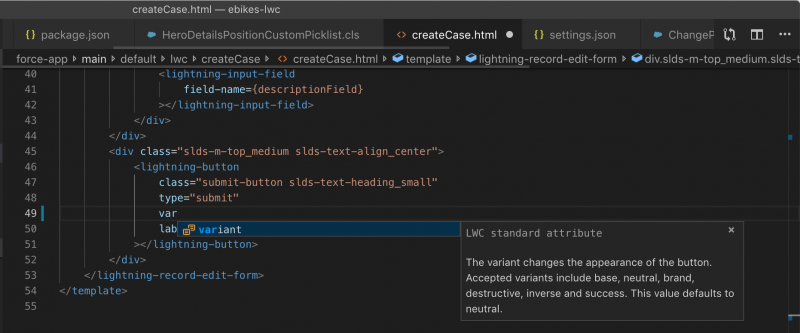
HTML code completions
When editing the HTML of a Lightning web component, you will see full code completion for elements, attributes, and values that include inline documentation.
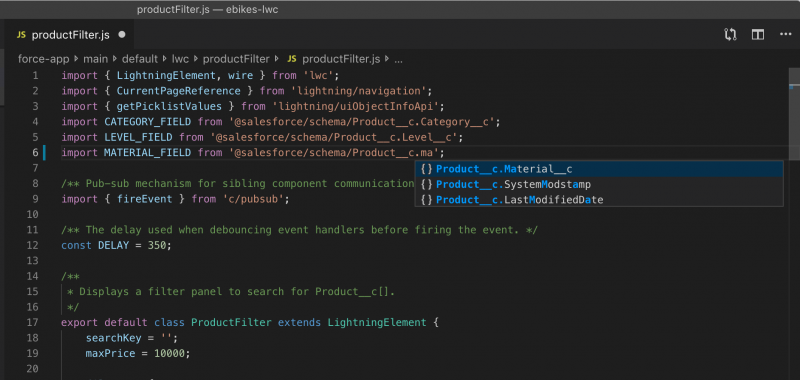
Javascript code completions
For LWC Javascript files you get code completion for your org’s schema, static resources, custom labels, and other LWC components.
ESLint integration
LWC provides out of the box support for ESLint to help ensure you write compatible and maintainable code. You will see error messages when you write unsupported code that will cause errors when running in your org and you will see warnings that will help ensure your code is consistent and maintainable.

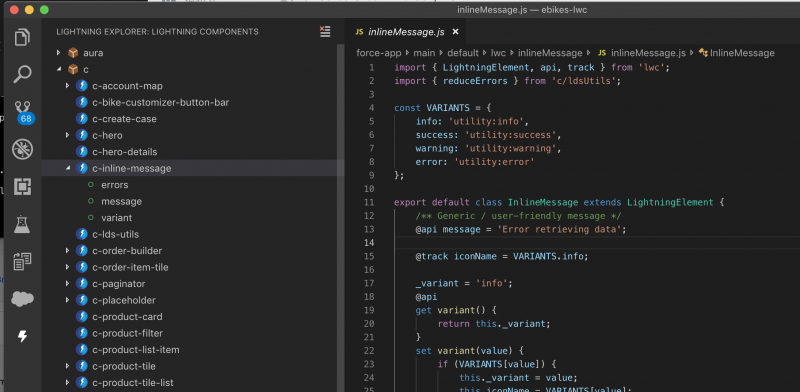
Lightning Explorer
The Lightning Explorer allows you to browse through all UI components in your project — LWC and Aura — as well as the build in components. You can browse the properties of the components and for the global components you can click to open the documentation for each item in the Component Library making it easy to find documentation and samples for building your LWC apps.
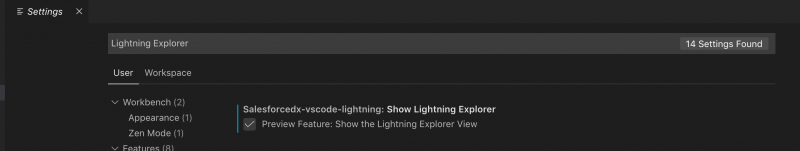
NOTE: This feature is in preview so to enable it you will need to enable the “Lightning Explorer” option in Settings.
General productivity
Apex refactoring
Refactoring is a common task for any developer as you maintain your application. VS Code now supports several ways of refactoring and quick-fixes for your Apex code such as rename variable, extract local variable, extract constant, and declare missing methods. Simply right-click on variables or methods and you will see the menu to perform various refactorings.
Code formatting
Keeping your code consistent between various developers makes maintaining your application significantly easy and helps new team members more easily read unfamiliar code. At Salesforce we have adopted Prettier in many of our projects and are standardizing on Prettier for Salesforce Platform development. We recently even added Prettier to the Developer Console. Prettier now supports all Salesforce languages and frameworks such as Aura, LWC, and even Apex. Prettier will help you keep your code consistent and avoid all those arguments about code formatting based on personal preferences. See the documentation on how to setup Prettier with your project today or just create a new project using the Salesforce CLI and it will include the default Prettier configuration for Salesforce.
Coming soon
I have written before about how we keep our roadmap up to date on Github. We strongly believe that developer tools are best built in the open with the end-users involved in providing feedback at every step of the way. If you haven’t commented on a Github issue or created a feature request I would encourage you to do so. We prioritize what gets built by the feedback we get from our customers. There are a few exciting features that we are currently working on that will make your development experience with VS Code even better.
Conflict detection on Deploy/Retrieve
A common problem when developing in a Sandbox is that multiple developers or admins can be working on the same metadata or code. This inevitably leads to conflicts. While we believe the best way to deal with this is to use source tracking with a version control system like Git, we understand that not every team is ready to adopt that model yet. For this reason, we are currently working on tools that will detect conflicts when you do a deploy or retrieve from your org. Initially this feature will work against Apex, LWC, Aura, and Visualforce but we will expand it to work against all metadata in the future.
We aim to ship the first of this feature in the next few months, but please let us know what you would like to see and how you would use this feature at your company by commenting on this Github Issue.
SOQL Language features
Today, when writing SOQL in VS Code we don’t provide code completion for other advanced language features that developers have come to expect from modern tooling. To remedy this, we are currently working on writing a full-featured SOQL Language Server that will provide code completion for SOQL keywords, objects, and fields to make it much easier to write queries both inside of Apex classes or anonymous files or by itself in a .soql file. You can see the spec and leave feedback on this Github Issue. Additionally, we aim to deliver more advanced SOQL tooling sometime in the future to help you more easily view results and work with data inside of VS Code. More details about those future tools can be found here.
Performance updates
One of the common complaints about using VS Code and the Salesforce CLI is that it is sometimes slow compared to other tools. One of the reasons for this is that long ago we made the decision to standardize all operations on the Metadata API. There are some benefits to this in terms of consistency, but there are also performance implications. The Metadata API is subject to queues in operations and at times the operations can back up and cause slow deployments. We have several efforts underway to improve this — one of which is working to make the Metadata API faster and more consistent. The other is on the tooling side. We are currently working on changing how single metadata operations for deploy/retrieve and push/pull are handled. Instead of using the Metadata API for these actions, we will use the Tooling API when there is only a single metadata type involved. While this won’t solve every performance issue, this will solve a big one when developers are using Deploy on Save – essentially each save will take less than a few hundred milliseconds so every save when doing Deploy on Save will generally use the Tooling API and feel basically instantaneous. I know this won’t solve every issue, so please continue to let us know how these issues are impacting you by commenting on this Github issue or by creating a new issue.
LWC Local Development
At TrailheaDX we teased LWC Local Development. This new feature will allow you to render your Lightning Web Components on your local machine without deploying them to the org. This means your time from saving to seeing the results will be almost instant. LWC Local Development will allow you to connect to org data through LDS or by calling Apex classes and will eventually support virtually every aspect of UI development related to LWC entirely on your local machine. You will see rich error messages when you make a mistake so you can quickly make the needed fixes without having to wait for a deployment to fail. The aim here is to dramatically increase the speed at which developers can write, test, and debug the UI applications. We will ship the beta of LWC Local Development sometime in the next few months.

MavensMate
Finally, I wanted to discuss MavensMate. MavensMate has been a great utility for the Salesforce developer community and we all appreciate the work that Joe Ferraro and others have put into the tool over the years. As you probably know, Joe discontinued working on MavensMate more than two years ago and recommended everyone migrate to the Salesforce Extensions for VS Code. Most people have already made the migration, but we know many of you were still using MavensMate.
If you were one of those people still using MavensMate, you noticed last week that it completely stopped working. The reason for this is because a serious security vulnerability was found in the software. Joe and the other project maintainers rightfully decided that rather than leave the users of this software — and the organizations where they work — vulnerable to a security compromise, that the correct course of action would be to disable the software entirely. They reached out to the Salesforce security team and disclosed the vulnerability. Because there was no way to fix the issue remotely or push out an update to MavensMate automatically, they concluded the only way to protect users was to revoke the application’s access to Salesforce APIs. They worked with Salesforce security to disable the Connected App and revoke all security tokens. This had the consequence of completely and permanently disabling MavensMate, but was the only way to ensure that users were secure.
I want to thank Joe for creating MavensMate and for the people that have been keeping it going for the past few years. MavensMate was an invaluable tool that pushed the Salesforce Developer platform forward. I also want to thank Joe and Charles Jonas for responsibility disclosing the issue to our security team and working to ensure that our mutual users were kept safe and secure.
For those of you that were still using MavensMate, we hope that you will find the Salesforce Extensions for Visual Studio Code to be a productive replacement. I would encourage you to try it out, even if you have before. If there is anything you think is lacking, please let us know by opening a feature request on Github.
Force.com IDE
As a reminder, if you are still using the Force.com IDE, that product will be complete discontinued in about three months on October 12, 2019. We will no longer provide support or any updates after that date. Additionally, the download links and documentation will be taken offline at that time. I highly recommend starting your transition to the Salesforce Extensions for VS Code as soon as possible. You can find a guide on migrating from the Force.com IDE to VS Code on our docs site.
As always, please continue to let us know what we can do to help you be more productive on the Salesforce Platform and thanks for reading!