What do you think the major differences are between Salesforce Classic and Salesforce Lightning? The user interface? More modern productivity tools? Both answers are right. But a peek behind the scenes reveals something entirely different — a difference in architecture. If you don’t understand why Lightning’s architecture was designed, you risk losing some performance gains, especially when using Salesforce on virtual desktop infrastructures (VDIs).
A brief history of Salesforce architecture
Salesforce Classic’s architecture was built for data entry and record keeping — you retrieve a record, change a record, put the record back in the cloud, and get another record. But during the last decade, the consumer web has changed dramatically. And expectations on what the web can do — and should do — have changed too. Enter Lightning Experience.
Lightning Experience’s architecture was built for action – helping you, the user, increase your productivity. Lightning lets you build end user experiences designed for productivity. To do that, the Lightning user interface is progressively loaded by the client, which is sensitive to browser and device performance. The Lightning UI requires many XHRs (XMLHttpRequests) to render a page, so it’s susceptible to network latency. Complex pages with many custom fields or components are slower to render, and even slower with low browser performance. Throw virtual desktops into the mix, and performance may be slower than anticipated.
Measure Lightning performance
The worst case scenario for Lightning Experience performance — slow network, slow browser, laptop running too many apps, complex page layout — can translate to a long Experience Page Time (EPT). And who wants to sit around and wait for a page to load? That can translate to a bad user experience, especially for call or service centers that rely on virtual desktops.
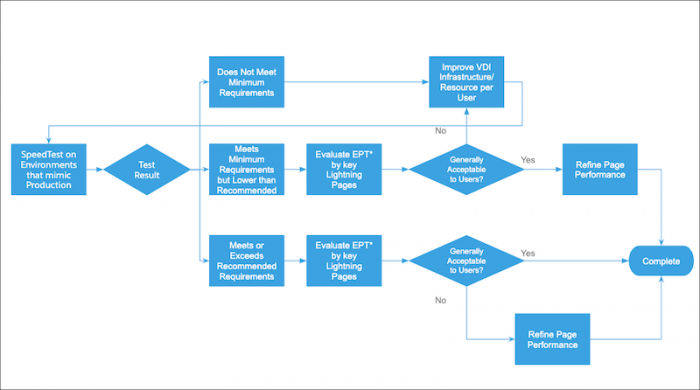
The first step to improving Lightning performance is to measure it. As management guru Peter Drucker famously said, “If you can’t measure it, you can’t improve it.” Salesforce strongly recommends measuring end user performance with a configuration identical to what you expect to use in production. Measure with the same geographic location, same hardware, same browser, same network settings, and the same expected concurrent usage patterns for shared hardware, such as virtual desktops.
Virtual desktops often have older CPUs that are shared by many users, resulting in slower page load times. To better predict how a virtual desktop performs with Lightning Experience, run performance tests from within the virtual environment with the same level of concurrent users and usage patterns as expected after rollout.
You can measure browser and device performance with an Octane score.
Octane score
Octane is a benchmark developed by Google that measures JavaScript performance. A higher Octane score correlates to faster page load times. Octane factors in your computer hardware and browser choice.
To find your Octane score, latency, and download speed, append speedtest.jsp to your org’s domain.
https://yourDomain.lightning.force.com/speedtest.jsp

Additionally, you can measure the page load times for Lightning Experience.
Lightning page load times
There are two ways you can add a load time counter directly in the Lightning UI:
- Lightning Component Debug Mode – This setting adds a counter in the top right corner of the Lightning UI that shows page load time and bandwidth. It’s important to note that with this setting enabled, component code is not minified, so overall performance may be impacted.
- Adding ?eptVisible=1 to the Lightning URL – For example,
https://<example>.lightning.force.com/one/one.app?eptVisible=1. Adding this string to your URL in the address bar adds a counter similar to the Lightning Component Debug Mode for showing the page load time, but it does not obfuscate component code, and so there is less of an impact on performance load time.
It’s important that the Lightning Framework bootstrap process (the page where the Salesforce release animation is displayed) is not included in measurements. If you reload the browser tab manually, the Lightning Framework is reloaded before any individual Lightning page is loaded, and including the load time from this process can result in inaccurate load times being measured.
With your Octane score and Lightning page load times in hand, you’re ready to compare it against the recommended technical requirements to achieve the best performance from Lightning Experience.
Requirements for the best Lightning performance
The second step to improving Lightning performance is to compare your org’s performance measurements to those recommended by Salesforce.
For the fastest and most stable experience, Salesforce recommends:
- An Octane score of 30,000 or higher
- Network latency of 150 ms or lower
- A download speed of 13 Mbps or higher
- At least 8 GB of RAM, with 3 GB available for Salesforce browser tabs
Minimum requirements are:
- An Octane score of 20,000 or higher
- Network latency of 200 ms or lower
- A download speed of 1 Mbps or higher
- At least 5 GB of RAM, with 2 GB available for Salesforce browser tabs
Using the minimum requirements results in ~50% slower page load times and login load times versus the recommended specifications. Due to memory limits, users that open over 1,000 records a day are also more likely to have their browser tab crash when using the minimum requirements.
Summary and next steps for better performance
If your Octane score is below the minimum requirements, or the actual page load times aren’t acceptable, Salesforce recommends that you upgrade your hardware, reduce the number of users per environment, or move to a dedicated desktop approach. Because the architecture for Lightning is based on building a better user experience, it may add cost.
Since every Salesforce customer’s application environment is different, there is no universal or reference architecture for perfect performance. Analysis has shown that the newer generations of CPUs — those with fewer cores rather than high density cores — improve performance. Finding a balance of users to cores is best, and you should plan to scale accordingly. Investigating and identifying this balance during times of slow performance is recommended. While memory and network speed affects performance, CPU is the single most important lever for improving Lightning Experience performance for virtual desktops.
Learn more on how to improve performance and speed in Lightning Experience here.
Resources
- Measuring Lightning Page Load Times (Knowledge Article)
- Enable Debug Mode for Lightning Components (Salesforce Help)
- Technical Requirements and Performance Best Practices (Salesforce Help)
- Salesforce Lightning Inspector Chrome Extension (Lightning Aura Developer Guide)
About the authors
Jim Tsiamis is a Vice President of Engineering at Salesforce, where he has focused on performance, scalability, reliability, and quality for over nine years. He has worked primarily on the Service Cloud products.
Gavin Austin is a Principal Technical Writer at Salesforce where he’s been writing a variety of content for over 15 years. He helped Salesforce radically change its content strategy in 2015, and he frequently speaks about content at conferences and universities.
Pak Fong is a Regional Success Architect Director at Salesforce based in San Francisco. He helps customers transform and achieve business value through optimal use of Salesforce technology.
Arun Costa is a Senior Director at Salesforce and leads the Service Cloud Performance Engineering team for over 6 years. He has extensive experience with Salesforce Lightning Console and has worked with multiple customers providing guidance on performance optimization for Console users.
Stephan Morais is a Vice President of Engineering at Salesforce, where he has overseen the development of our UI platforms for over 10 years. He has a special focus in UI performance and has worked with numerous customers to help them optimize their Visualforce, mobile, and Lightning implementations.