Is it time to expand Salesforce within your company? Then it’s also time to develop a performance testing method so you can be confident that your solution can scale to meet your user needs without unwanted side effects. This article is part one of a series on performance testing. In part one, we’ll address how to establish a strategy and have confidence in your ability to grow. Part two of the series will dive a bit deeper, and focus on the nuances of performance testing on the Salesforce Lightning Platform.
When you first started building your Salesforce implementation, probably anything that was deployed was peppy and responsive. Searches responded instantly. Page loads were less than two seconds. All the users could be fully engaged without any noticeable effect on the system.
Now you need to grow the system, whether that means user base, data volume, or requests per second. Furthermore, you’re asked to confirm that your solution will perform at-scale. This article provides guidance on how to solve these challenges through performance testing.
In this introduction to performance testing, we’ll define the testing process and explore the best practices for selecting metrics and taking measurements. Finally, we’ll look at how to build a strategy for sharing test results with stakeholders.
Why do you need performance testing?
To verify performance — but first clarify your issues with a series of questions. Is the increase large enough to be concerned about? Are you concerned about the general increase of users? Are there a specific set of user behaviors that might be an issue? Is the amount of data growing at a fast rate? Are requests running too long or even timing out? Is there a feature that is being used beyond its capacity?
Every business situation is unique. Increasing one system by 10,000 users might not cause the same issues as growing another system by the same amount. To understand the context, you need to identify your projected growth pattern. After you understand that pattern, you can evaluate whether it fits some of the common challenging growth patterns, such as:
- Changing by an order of magnitude or more
- Growing exponentially
- Rapidly or repeatedly doubling
If the growth pattern is problematic, then you definitely need a way to determine if the system can meet future needs, preferably a methodical, repeatable approach that can complement your existing software delivery process. This approach is known as performance testing.
What is performance testing?
Performance testing is about establishing confidence by observing how a system performs while it’s being used, often in increasing amounts of utilization. Performance testing is a deep topic, but you can simplify it by viewing it from two perspectives: the process of performance testing and the technical aspects on how to test. Before you dive in, some expectations should be set.
The Salesforce Platform is multitenant. That means that the underlying resources that power your Salesforce experience are shared by other customers. Intentionally overloading those resources to find their breaking point isn’t neighborly and is not allowed.
Limits and allocations
Developing performance tests is similar to Salesforce custom development in the sense that tests must operate within the same platform limits as customizations.
Hardware and software are resources that are used to power businesses. These resources must be actively tended to in order to stay healthy. For example, it’s not healthy to run a CPU at high-utilization consistently. A resource that is overstressed might behave erratically or even crash.
The Salesforce Platform works hard to ensure that resources don’t become overwhelmed. To prevent customizations from overloading the system, a governor manages resource use and capacity. If you exceed the capacity, then the governor enforces a limit. This might cause errors, or in some cases, throttling.
Limits differ based on the resource type and access pattern. For more information, check out the Salesforce Developer Limits and Allocations Quick Reference document.
Coordinate testing with Salesforce
Performance tests can generate large amounts of traffic. The Salesforce infrastructure teams work hard to make sure that systems are reliable and available. Part of that is identifying malicious traffic and unapproved system behavior.
To avoid having your tests flagged as malicious activity, give Salesforce a heads-up about your testing plans by filing a support ticket. To learn how or learn more about the conditions where this is required, check out the Salesforce Performance test FAQs. If you’re not sure whether your testing plan is substantial enough to apply here, work with your Salesforce account team.
Don’t test in a production environment
Because Salesforce is a multitenant platform, performance testing is not permitted in production environments. Use a full copy sandbox for testing.
The testing process
It’s tempting to simply automate a demanding test targeting Salesforce and then issue a judgment about scalability. Don’t do that. To avoid false conclusions, use a more methodical process.
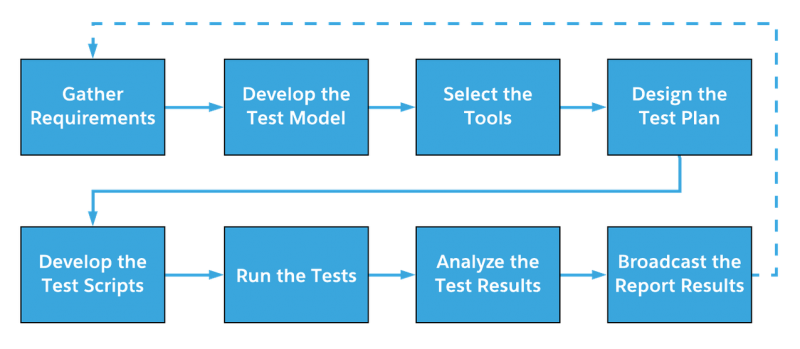
Performance testing is similar to the software development lifecycle. You need to gather requirements before doing anything. After you have a clear, documented definition of what needs to be tested, then you can go about the business of selecting testing tools.
The tools drive the test plan. Once the test plan is established, you can then start the fun part of writing tests. Before officially running tests, take the time to establish a test model. The model is the lens that you view the test results through. After running the tests and comparing the results to the model, then share the conclusions with stakeholders.
Create a test plan
Performance testing is a team sport. It requires communicating effectively across product owners, administrators, developers, and testing teams. The test plan is a tool to keep all participants and stakeholders on the same page.
At a minimum, document and share the following:
- High-level view of the environment being tested
- Schedule of when the tests are performed
- List of individuals and their responsibilities in testing
- List of scenarios that are tested
- Testing success criteria
- How results are communicated
Documenting all of the above sounds like a lot of work, but consider that it’s faster and easier to share a link to the test plan than to repeat yourself in multiple stakeholder meetings.
Know what to measure
Performance testing is about measuring, but what should you measure? The Salesforce Platform is built with web technologies and is accessible with the internet. Because of this, it’s tempting to use metrics that are common for testing general web apps, such as page response time or time to first byte. Salesforce isn’t a general web application though. You should use metrics that take into account the Salesforce architecture.
Measuring the Salesforce user experience
When you measure user experience in Salesforce Lightning Apps and Lightning Communities, we recommend that you use Experienced Page Time (EPT).
EPT is designed to take into account the underlying architecture of Salesforce Lightning pages. Lightning pages have multiple components on them. Each component has the ability to communicate with the Salesforce backend. Component chattiness can create a disconnect between a page when it is fully rendered and when it is actually usable. EPT measures when the page becomes usable.
For details about how to view EPT in the browser with the Lightning Usage App and Event Monitoring, see the Measure Performance for Your Salesforce Org document.
Server-side metrics
EPT is measured from the client’s perspective, but that’s only half of the story. Salesforce is hosted by a robust infrastructure. You can gain insight into how Salesforce is performing on the server side during a test run with Shield Event Monitoring.
There are a large number of metrics that are enabled with event monitoring. It can be overwhelming when trying to decide where to start. As a best practice, consider starting with the following:
- Run Time (RUN_TIME): What was the total amount of time for the request?
- CPU Time (CPU_TIME): How much time is spent in the application tier?
- Database CPU Time (DB_CPU_TIME): How much time is spent in the database tier?
- Database Total Time (DB_TOTAL_TIME): How much time does it take to make a database call?
The event types supported by event monitoring are stored in the EventLogFile standard object and their individual schemas are detailed in the object reference developer documentation.
There are many event types for inspecting Salesforce behavior. The table below highlights some that are useful for performance testing.
| Apex Execution | API Introspection | User Experience |
| – Apex Callout Event – Apex Execution Event – Apex Trigger Event – Continuation Callout Summary Event – Queued Execution Event – Time-Based Workflow Event |
– Apex REST API Event – Apex SOAP Event – API Event Type – REST API Event |
– Console Event – Lightning Performance Event – Wave Performance Event |
Stitching events together
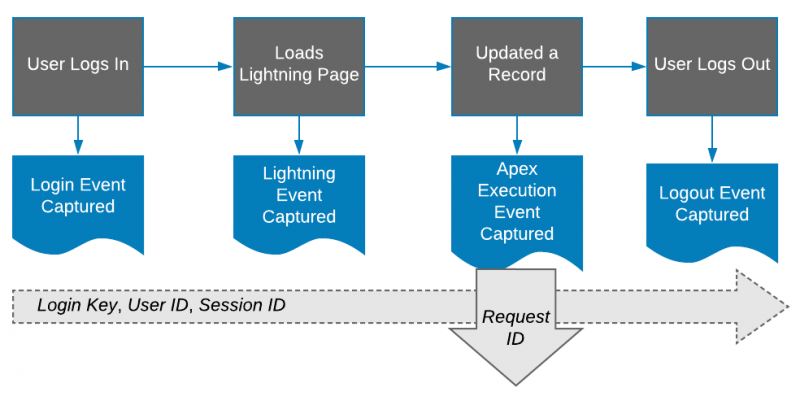
During a test run, you may need to associate multiple events together to get a full picture of what’s happening. You can relate events to each other by using the fields USER_ID, SESSION_KEY, LOGIN_KEY, and REQUEST_ID.
As shown in the image below, these fields have different scopes. While USER_ID, SESSION_KEY, and LOGIN_KEY can be used to associate events performed by a specific user or during a specific web session, REQUEST_ID is used to associate events that are generated by a front-end request back to the Salesforce Platform.
Thinking in aggregate
Performance test results are used to establish confidence and inform decisions. You want to make decisions based on good information. Measuring metrics on just a single page load provides anecdotal evidence at best. It’s a best practice to run tests many times and then form conclusions based on the aggregate values of the test runs.
Use the following methods to collect measurements:
- Mean/Average: Add all of the measurements together and divide by the number of measurements.
- Median: The middle point of the measurements; half the numbers are above the median and half are below it.
- Percentiles: These are useful in gaining perspective. The 95th percentile—P95—is a way to say that 95% of the measurements were less than a specific value.
Think time
Consider human behavior when designing tests. You can write tests that run as fast as the computers running them. However, this doesn’t provide an accurate picture of how Salesforce is used in real life.
Computers don’t behave like people. People pause in between tasks. They take a minute to read. They take a breath or sip of coffee. They toggle between tabs. The time between user activities is referred to as think time.
Simple tests can use a constant value (e.g. 100 ms) for think time. It’s more realistic to use a distribution of think time values. How you specify think time in tests is specific to the testing tools you select.
Develop a test model
The test model, which is sometimes referred to as a workload model, is what separates performance testing from ad hoc analysis. The better the model, the closer the test conclusions will be to reality. A test model is similar to a weather forecast or stock market projection. The model is not a 100% accurate representation of reality. Rather, it’s an educated approximation of how you believe you can simulate future system utilization patterns.
Developing test models can be complex, so we won’t go into details here. As it’s an important step of the performance testing process, here’s a brief description.
At a minimum, your test model should define:
- The measurements and methods for the tests
- The key scenarios to test
- The data sets required for testing
- The system’s access patterns and network paths
- The utilization distribution of the various scenarios (i.e., the search feature may be utilized at a much higher rate than order creation)
- The normal and peak system load required for each test scenario
For more information about test models, check out Modeling the Real World for Load Testing Web Sites on the Software Development Magazine website and Performance Test Workload Modeling on the AgileLoad website.
There are two methods of measuring systems that come up frequently in performance testing models: throughput and response time. These deserve an introduction.
Throughput
Systems are built to perform work for users. The number of units of work the system can process in an amount of time is called throughput. When measuring throughput, higher numbers are better.
From a Salesforce perspective, examples of throughput are:
- The number of records like leads, orders, opportunities, or cases created per minute
- The number of searches completed per hour
- The number of product views on a community per day
Response time
Response time is the amount of time it takes for the system to process a request. You want systems to have the highest possible throughout with the lowest possible response time. Examples of response time in Salesforce are:
- The number of milliseconds to create an order
- The number of milliseconds to load the account record page
For more information about throughput and response time, see the whitepaper Benchmarking Blunders and Things That Go Bump in the Night by Neil J. Gunther. Published on April 21, 2004.
Establish baselines
After you have a model for testing, it’s important to establish baseline measurements of how the system performs when idle. You need these measurements before doing performance testing so that you can compare the effects of your newest solutions against established norms.
Some tips on measuring baselines:
- Run the baseline tests multiple times and at different points during the day and night
- Use the median value (50th percentile) of all the tests as the baseline value
- Run the baseline test with a single user or thread
- Ensure the system is not being used by other tests or users
Publish a test results report
After the test analysis is complete, you’ll want to save several test result documents that detail how tests were performed and the nuanced results. As useful as these are, most people don’t need to wade through the details. Rather, they need a high-level summary. The test results report is responsible for communicating the conclusions to all stakeholders.
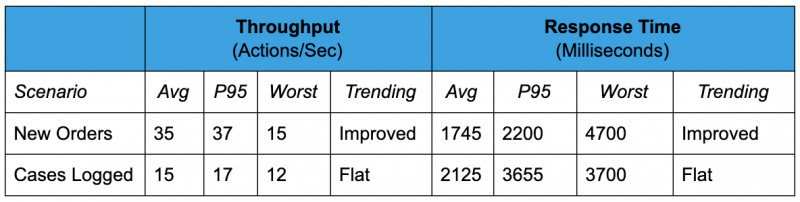
The main challenge with compiling the test result report is deciding what information is worth communicating. The report should be short and designed to enable decision making. Stakeholders need to understand what scenarios are worth more attention.
The table below is an example of how a couple test result scenarios can be simplified and combined into a single report.
Some tips on creating a successful test result report:
- Show results as a trend over time
- Use consistent measures across all scenarios, and from report to report
- Have a separate glossary explaining metrics, key performance indicators, and measures
- Make old reports available
- Enable a subscription system, so readers are notified when new reports are published. An example might be a Salesforce Chatter group to organize testing activities; stakeholders can subscribe for updates, and it’s a great place to share test plans
Conclusion
You now have the foundational knowledge of performance testing. Use this knowledge to scale with confidence by incorporating the techniques included here to test, measure, and inform your optimizations. When you’re ready to continue the journey, check out part two of this series: Performance Testing on the Lightning Platform.
About the authors
Samuel Holloway is a Regional Success Architect Director at Salesforce. He focuses on custom development, enterprise architecture, and scaling solutions across the Salesforce clouds. When he’s not building solutions at Salesforce, he enjoys tinkering with computer graphics and game engines. You can see what he’s up to at GitHub @sholloway.
Mahanthi Gangadhar is a Certified Technical Architect at Salesforce. He is focused on the B2B CRM space as a Salesforce Performance Architect. He has worked with some of the largest Salesforce enterprise customers in conjunction with the Frontier Scale Team to enable customers to scale way beyond normal expectations.