
Testing code is part of the basics for developers, but how do you keep track of what needs to be tested? In this post, you’ll learn about code coverage and how it can help you test efficiently. We’ll present a set of tools that you can use to retrieve code coverage for Apex and Lightning Web Components (LWC) and how you can automate this process.
Understanding code coverage
Code coverage is a measure (expressed as a percentage) that describe how much of your code is tested. It’s calculated by taking the number lines that are executed by your test code, dividing it by the total number of lines of your code base (excluding test code) and multiplying the result by 100.

A common misconception is to think that a high code coverage implies good test quality. That is not necessarily the case. One could write a large number of tests that do not test with the right values or assertions. In other words, code coverage implies quantity not quality.
Rather than looking solely at the final measure, you should use code coverage to help you identify untested code. Thankfully there are a set of great tools that are designed for that.
Measuring and analyzing code coverage with tools
In this post we’ll present three levels of tools ranging from the simplest to the most advanced:
- The bare minimum – A set of CLI commands.
- The comfortable approach – IDE extensions for your day to day work.
- The long term vision – CI and automation tools to get the most out of your projects.
1. The bare minimum
Apex code coverage with the Salesforce CLI
You can retrieve Apex code coverage with the Salesforce CLI by running the following command:
1sfdx force:apex:test:run --codecoverage --resultformat humanThis runs all Apex tests in your org’s namespace and displays the following output:
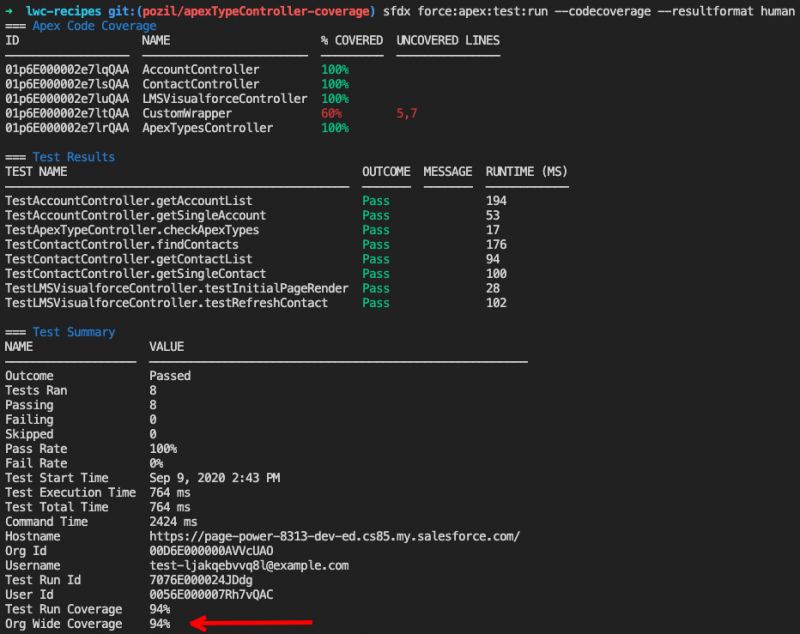
Here you can see the coverage per file, the uncovered lines and the org-wide Apex code coverage.
LWC code coverage with the Jest CLI
Just like for Apex, you can obtain code coverage for Lightning Web Components with a CLI.
However, requirements are different for LWC because tests run on your local machine instead of the org. Assuming that you’re starting from an existing project and that you have a Node.js LTS version installed, you need to:
- Install the Node.js project by running this command in a terminal at the project root:
1npm install- Run the Jest coverage script:
1npm run test:unit:coverageThis runs all of your project’s LWC tests on your machine and displays the following output:

Here you can see the coverage per file, the uncovered lines and the project-wide LWC code coverage.
While the CLIs for Apex and LWC are extremely useful, there are some tools that are more comfortable and seamless for daily use.
2. The comfortable approach
Instead of having to type CLI commands, you can benefit from IDE extensions that continuously run tests and retrieve code coverage behind the scenes, and provide you with code overlays. Here are two examples for VS Code, our officially recommended IDE.
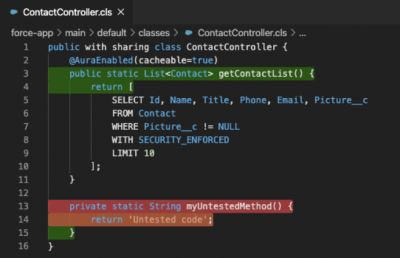
Apex code coverage overlay
The official Salesforce Extension Pack for VS Code provides an Apex code coverage overlay. However, this feature is not enabled by default for performance reasons (running tests with code coverage computation takes longer). Follow these instructions to enable the overlay. You’ll see covered lines in green and uncovered lines in red.

Remember that Apex test runs and code coverage are based on what’s in your org, not on your local project. If you forget to deploy changes from your local project, you’ll get mismatching coverage.
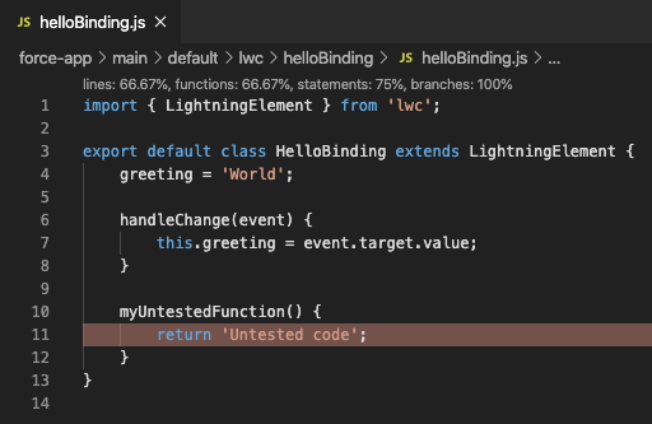
LWC code coverage overlay
Displaying a code coverage for LWC requires a third party VS Code extension and a few extra steps. Follow these instructions to install the extension, configure it for use in your Salesforce project, and enable the overlay.
One you’ve set up the extension, Jest will run in watch mode behind the scene and continuously collect code coverage. Covered lines won’t be highlighted in green but you’ll see uncovered code highlighted in red. You’ll also get an extra line with file coverage stats on top of your editor window.
Now that you know about the tools for personal/local development, let’s up our game and dive into CI and automation tools to get the most out of your projects.
3. The long term vision
Checking for code coverage on your individual development environment is a good first step but you need to go beyond that when you collaborate with a team on a project. You need to automate code coverage tracking and monitor its evolution through time. You want it to remain stable or to go up. If you notice that the trend is declining, then you need to take corrective action.
In this post we’ll use GitHub Actions for CI and Codecov for code coverage auditing/collaboration because both tools are free for open source projects, but note that there are other alternatives. As an example, we’ll use LWC Recipes, one of our sample applications. The .github/workflows/scratch-org-sfdx-ci-master.yml file showcases how GitHub Actions and Codecov integrate together:

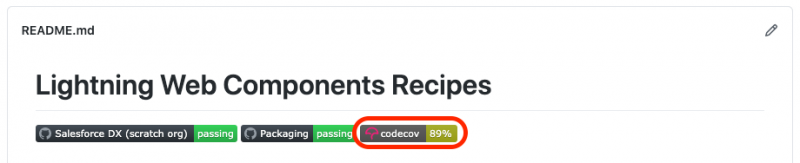
Notice that we use the same two CLI commands that we would run in our development environment to run Apex and LWC tests and generate code coverage reports (npm run unit:test:coverage and sfdx force:apex test:run). After that, we just have to add an extra Codecov action that uploads the two reports to codecov.io. Codecov will then aggregate the reports into a consolidated view.
Thanks to that, we can add a code coverage badge on our project readme:
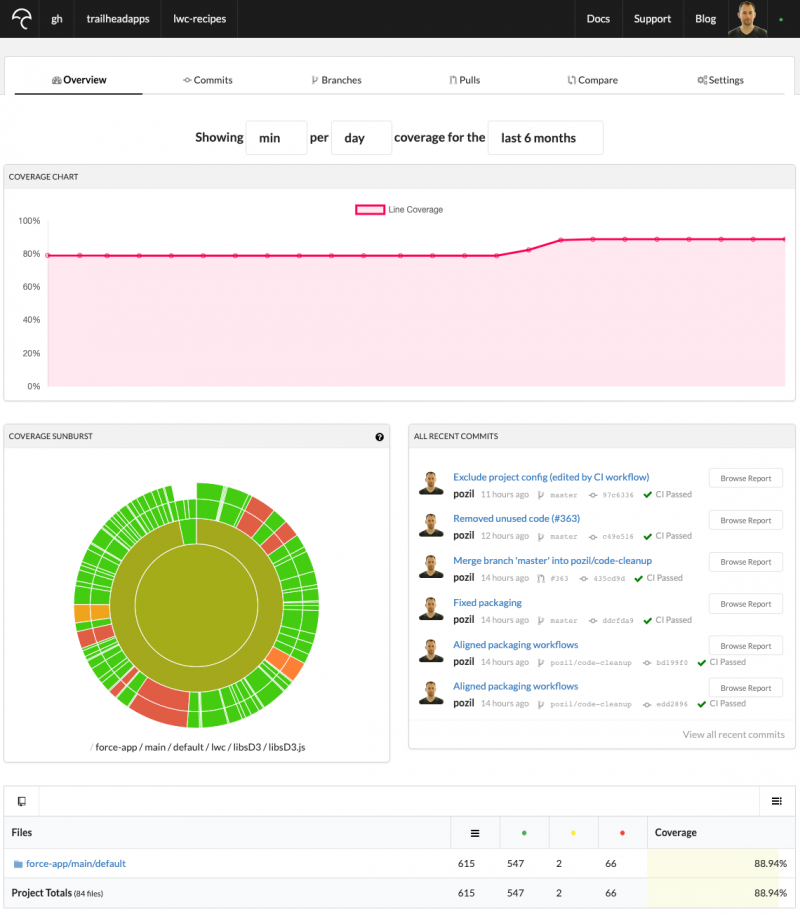
And, most interestingly, we can leverage a Codecov dashboard. This lets us monitor code coverage evolution through time and visually inspect code coverage gaps.
We mentioned earlier that you might have to take corrective actions if you notice that code coverage is declining over time. The good news is that Codecov provides a convenient bot feature that helps you detect this problem before it’s merged into your codebase. The Codecov bot automatically comments on Pull Requests (PR) to provide you with an inline view of how a particular PR would affect your project’s code coverage.
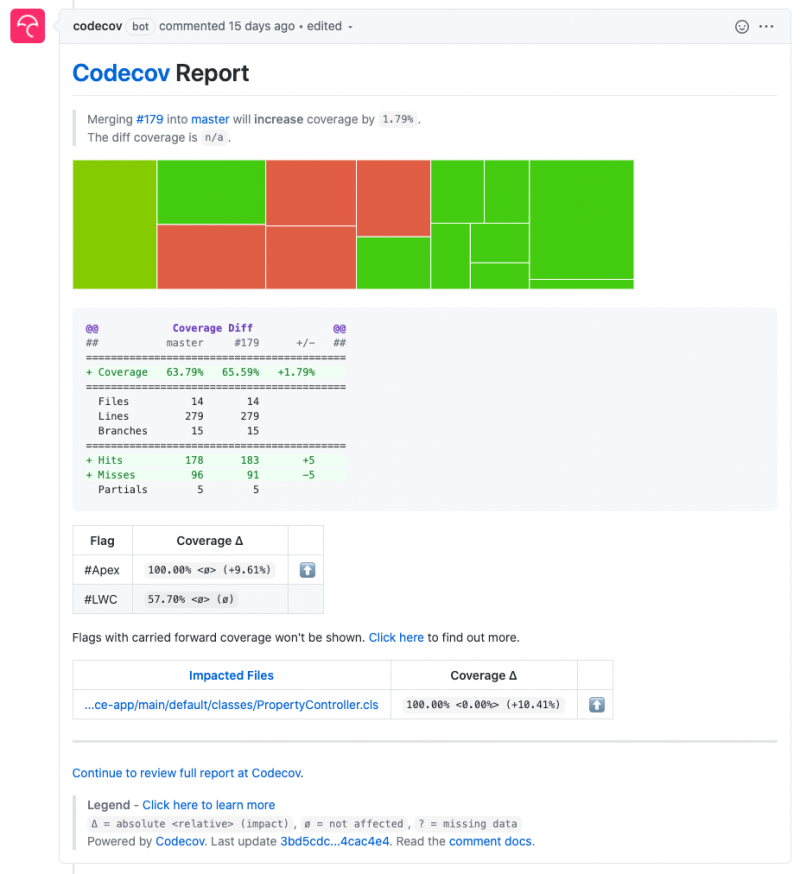
In the example above we see that the current PR would increase the project’s code coverage by 1.79% and we see that 100% coverage was added for the PropertyController Apex class (it wasn’t tested before) without looking at the code.
This feature is particularly useful in open source projects where you don’t necessarily know contributors and want to guard yourself against accepting untested code.
Closing words
That’s a wrap, we’ve covered what code coverage is and walked you through a variety of tools that helps you drive your testing strategy.
Always remember that code coverage is useful for finding untested code, but it is not sufficient as a quality target. Make sure to use all the tools at your disposal to track code coverage. Don’t hesitate to automate code coverage tracking and monitor its evolution though time.
Resources
- Apex Developer Guide – Code coverage best practices
- Sample Apps
- TrailheadLive session
- Developer Quick Takes (short how-to videos)
About the author
Philippe Ozil is a Principal Developer Evangelist at Salesforce where he focuses on the Salesforce Platform. He writes technical content and speaks frequently at conferences. He is a full stack developer and enjoys working on robotics and VR projects. Follow him on Twitter @PhilippeOzil or check his GitHub projects @pozil.