When trying to diagnose an issue, Apex logs are a rich source of information. A debug log can record database operations, system processes, code executing in managed packages, and errors that occur when executing a transaction or running unit tests. However, consuming logs in their raw format can burn some calories before you can understand and pin down the issue.
FinancialForce built a tool to help their internal development team parse logs faster, and are generously making it available to all. This tool is built as an extension, so you can access it right in Visual Studio Code. Let’s check out some of what you can do with this new extension.
A picture is worth a thousand words
If you’ve ever read through an Apex debug log and tried to map the call tree in your mind, you know it’s not easy. It can be difficult to visualize the nested calls and duration of each method or statement, plus untangle the responsibilities of managed packages and Flows in the overall execution. The Timeline view in the Log Analyzer lets you see the call tree as a timeline. You can see what calls are nested and get an idea of the areas of code taking the longest to complete. This gives you quick visual clues to zero in on potential trouble areas. This can be a great timesaver when trying to figure out an issue.
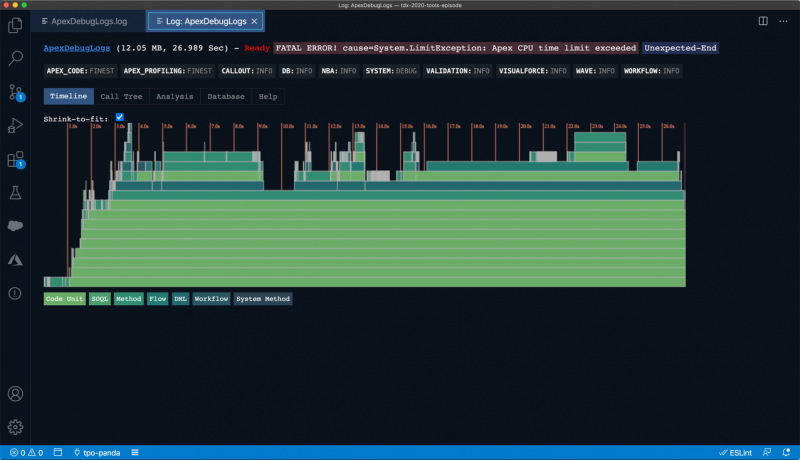
You can shrink it to fit the entire log onscreen or focus on a specific portion. You can hover to see the details of the call and click to go directly to the line in the Call Tree view. This view gives you an expandable tree of all the log details. You can click any method to go directly to the source code in your project, provided you have that source locally.
Spot problems faster
It can be tough to find performance issues. General reports of slowness from users don’t always give you a lot to go on. SOQL queries and DML statements are common areas that cause some performance issues. To help you find those issues faster, there are two other views that are helpful:
- Analysis – This tab gives you a summary of method performance, showing you total duration, net duration and number of times each is called. The methods taking the longest and being called the most can be a good place to look for potential optimizations. You can sort the list by any of the fields to let you focus on what you’re most interested in.
- Database – This tab gives you a breakdown of the DML and SOQL queries contained in the log. For each, you can see the number of times a statement is executed and the number of rows. If you have a query that you are expecting to fetch few records and see it grabbing hundreds – that’s a place to investigate further. By focusing on the DML and SOQL statements using the most data, you can spend your time wisely when optimizing or trying to solve a performance issue.
Conclusion
We hope you’ll check out this new tool to help you interpret Apex logs faster. Whether you’re trying to solve a user’s issue or tune performance, this is a handy tool to have at your disposal. At Salesforce, we’re committed to building our tools in the open, and we’re thrilled to see another tool for the community. Install the extension from the VS Code Marketplace. If you’d like to contribute or provide feedback, check out the repo.
About the author
Stephanie Maddox is the Product Manager for the Salesforce Extensions for VS Code. She joined ExactTarget in March 2010 and became an official part of Salesforce in July 2013 as a part of that acquisition. During her career at Salesforce, she has focused on Customer Success and Product Management. She holds a degree in Computer Science from Ball State University and spent the first 8 years of her career as a developer. You can follow her on Twitter, LinkedIn and Trailhead.