
Previously, developers had to perform multiple tasks to run the Apex Replay Debugger, which was time consuming and laborious. Good news! Starting in February 2022, we streamlined the SFDX: Launch Apex Replay Debugger with Current File command, and it now works without needing to leave Visual Studio Code. This means that you no longer need to create trace flags and open a log file — it’s all done for you.
To run the Apex Replay Debugger, you simply run the command! Previously, to debug an Apex test class one needed to:
- Log into an org
- Manually create a trace flag
- Switch back to Visual Studio Code
- Run their tests
- Open the log file that was generated
- Then (finally!) start debugging
Now, all you need to do is run the SFDX: Launch Apex Replay Debugger with Current File command.

With this update, there’s no need to log into your org and create a trace flag (we do that for you), and there’s no need to generate and load a log file (we do that for you as well). Simply add breakpoints or checkpoints to your Apex test file, then run the SFDX: Launch Apex Replay Debugger with Current File command, and start debugging your code.

Debug Apex tests, anonymous Apex, and Apex logs
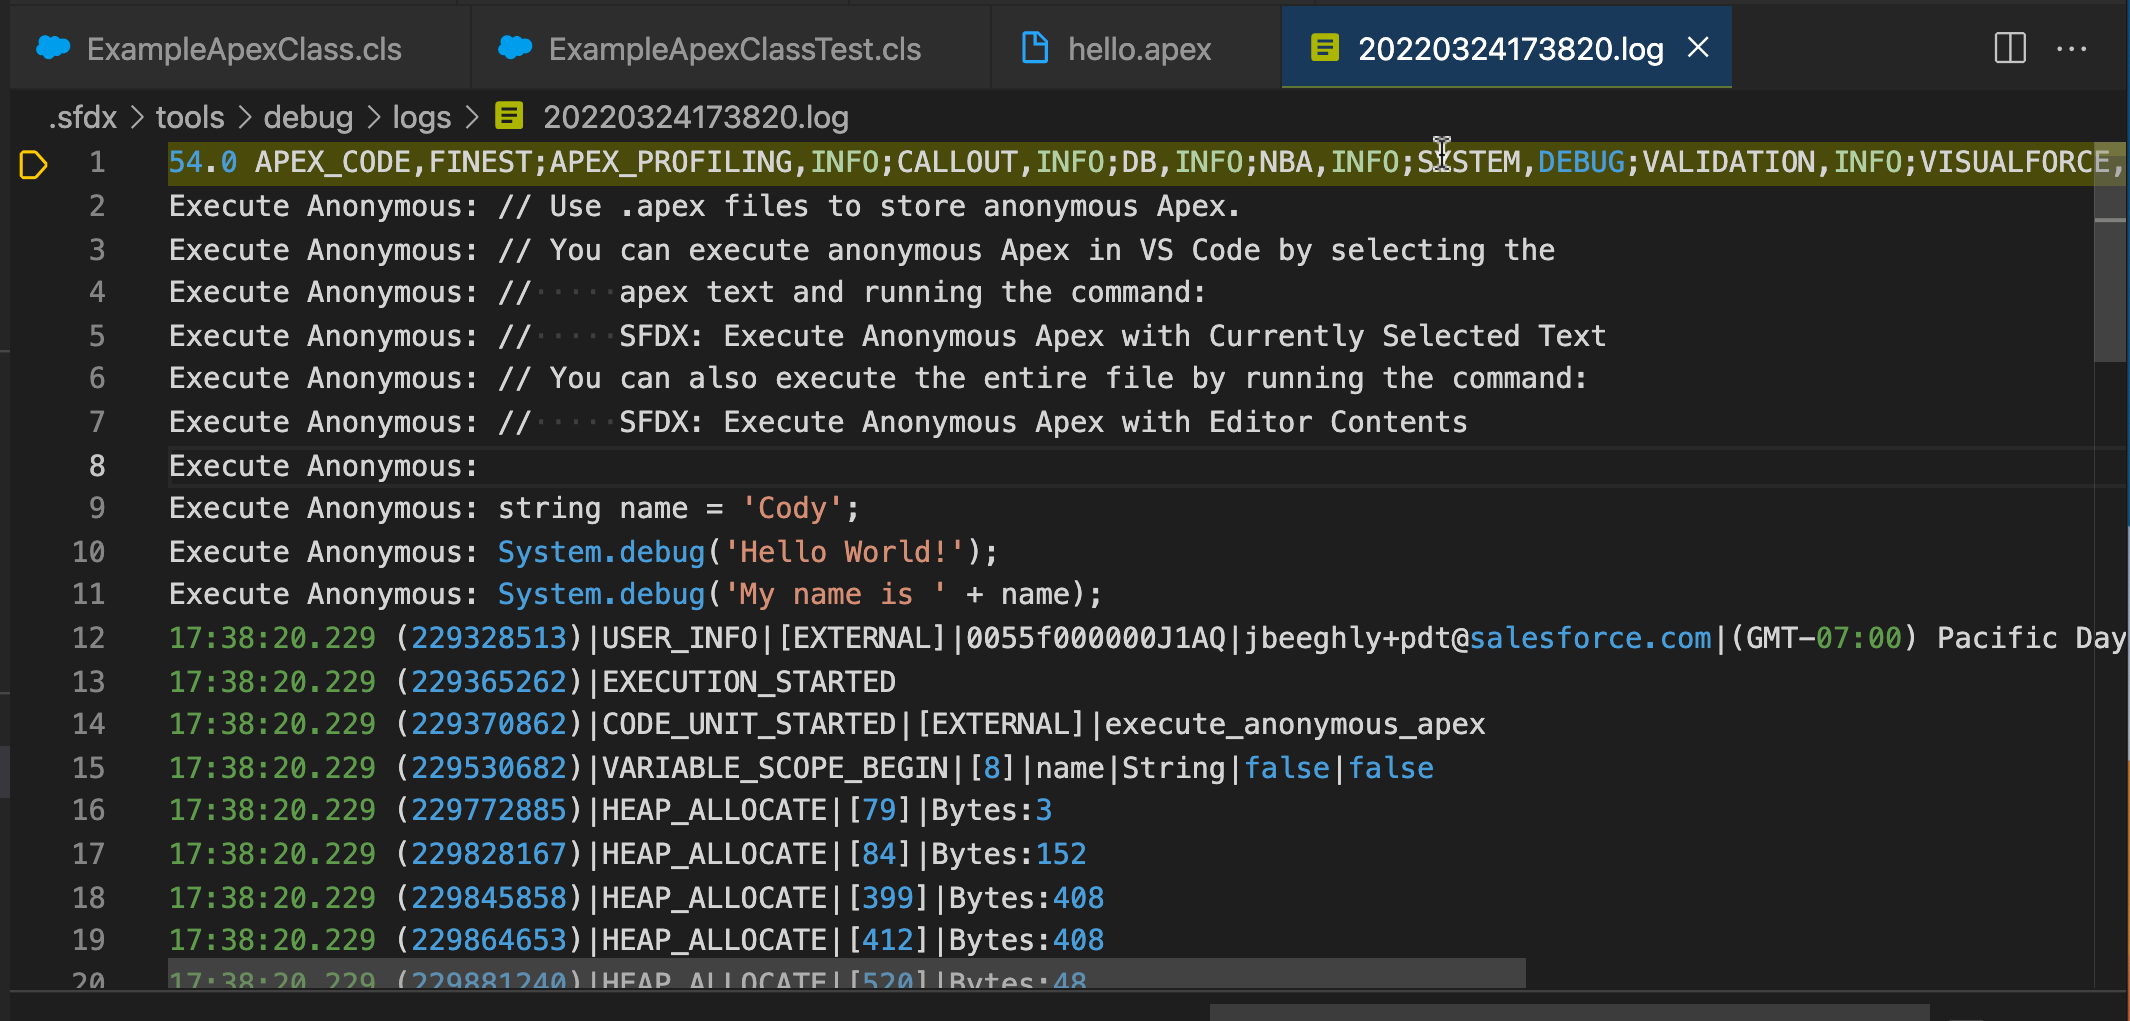
In addition to debugging Apex test files, we’ve also added the ability to debug anonymous Apex files. Simply use the same SFDX: Launch Apex Replay Debugger with Current File command with a .apex file.

After starting the SFDX: Launch Apex Replay Debugger with Current File command for an anonymous Apex class, the log file will automatically open and the user is able to debug and step through the log file.
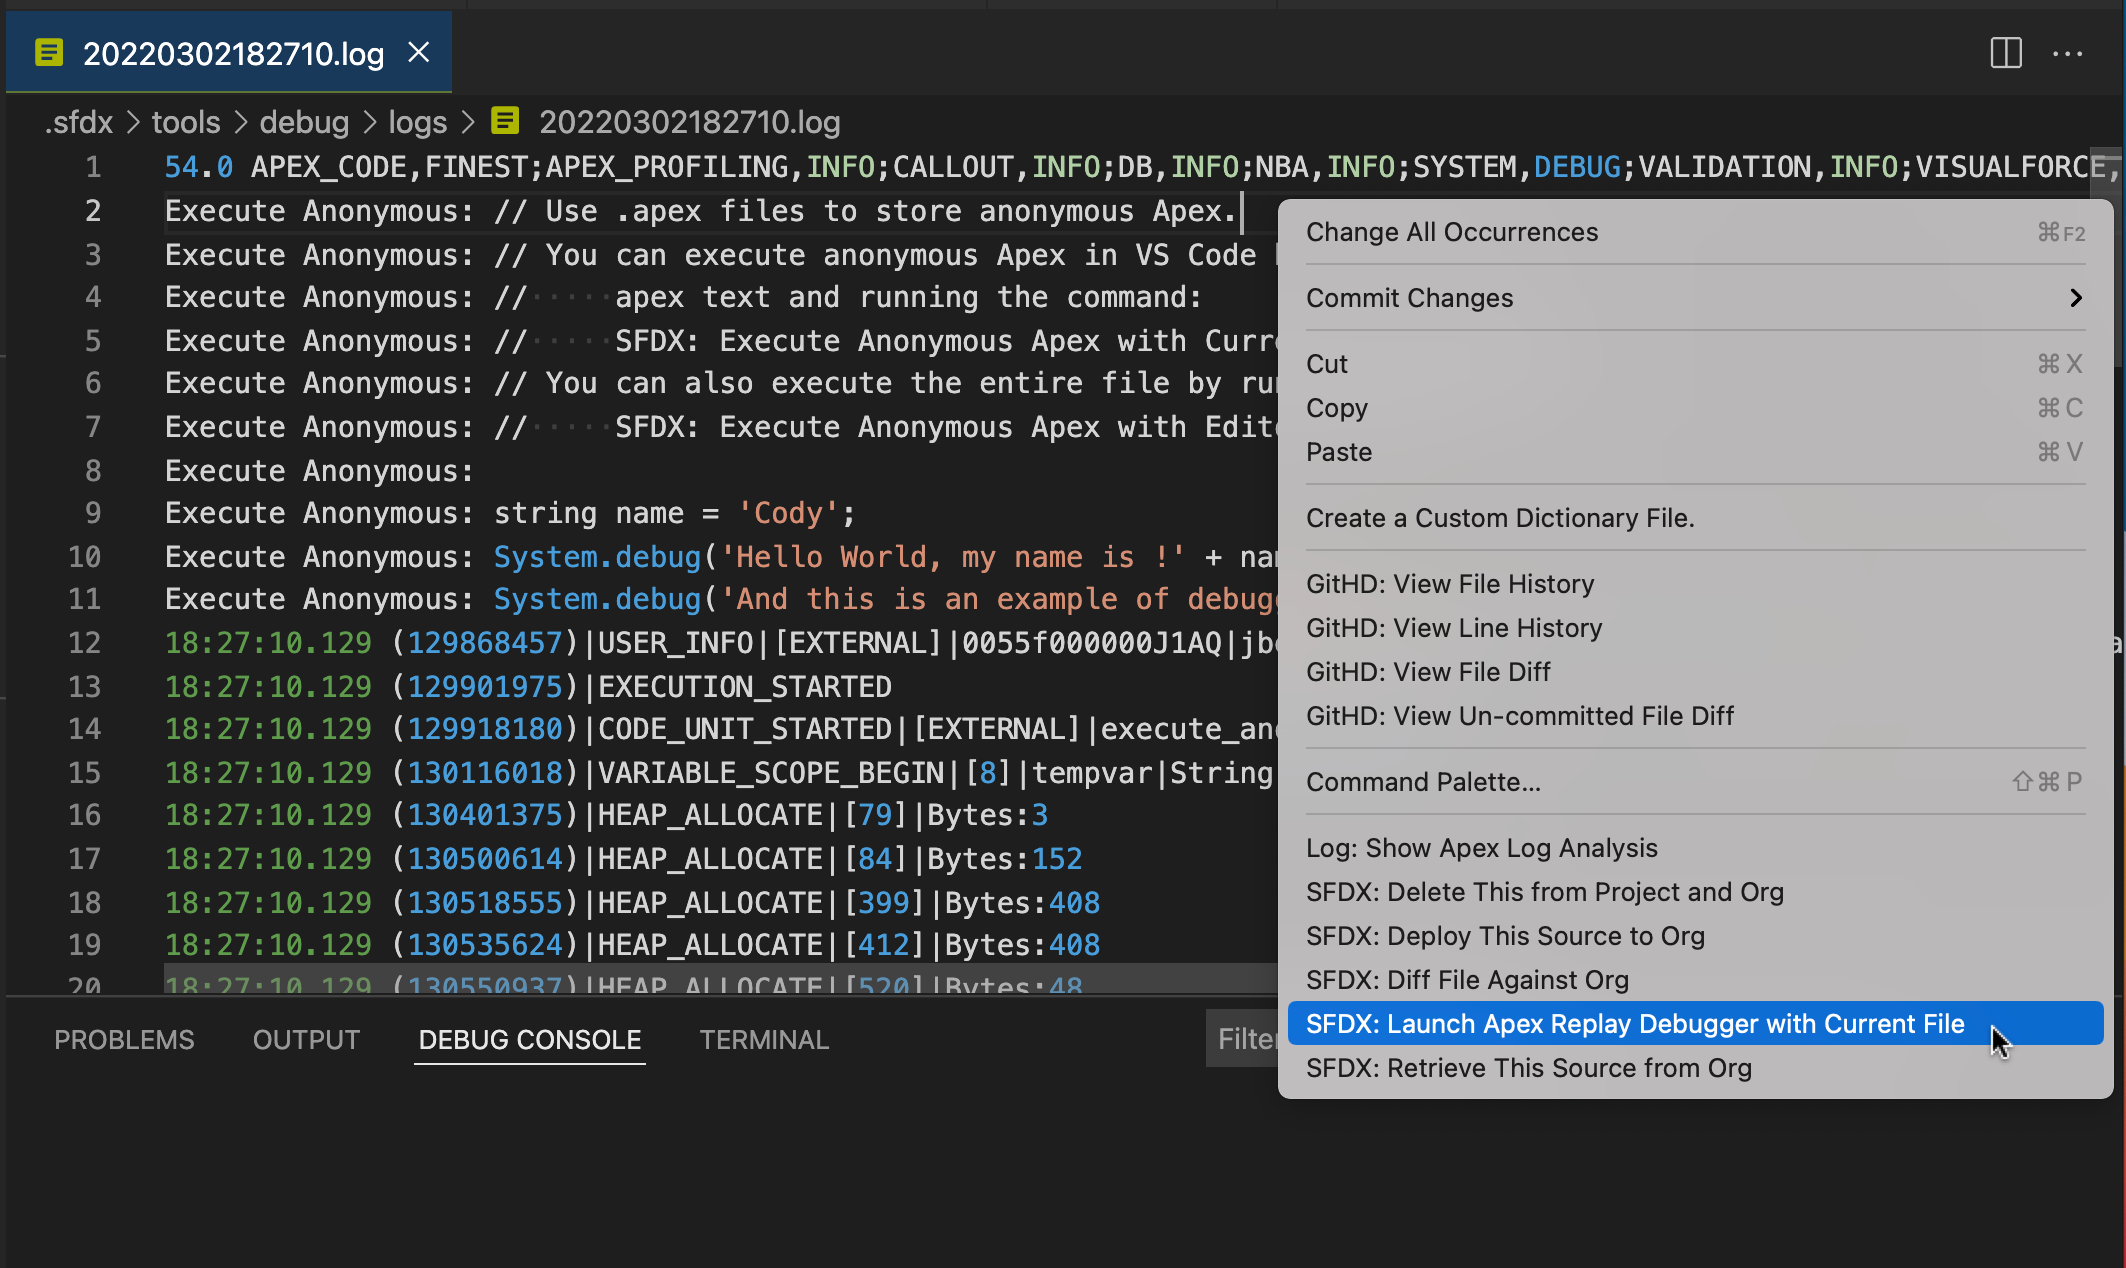
Another place that you can utilize this handy new functionality is with Apex log files. There’s no need to create a trace flag since we do that for you; now all you need to do is run the command.
Conclusion
Now, using the same SFDX: Launch Apex Replay Debugger with Current File command, you can debug Apex tests, anonymous Apex, or Apex logs — each without needing to create a trace flags or load a separate log file. We alleviated some of the extra (and tedious) steps needed in order to debug and made the existing command even easier.
To learn more, see the documentation or dive into the Trailhead project: Find and Fix Bugs with Apex Replay Debugger.
About the author
Jeff Beeghly is a Senior Software Engineer at Salesforce. He works on Salesforce Extensions for Visual Studio Code.