At times, developers and architects come onboard at the firefighting phase of a customer implementation. This is usually after the implementation is complete and applications are running into multiple performance-related issues. Users may be complaining of regular slowdowns or governor limit exceptions may be coming up in multiple areas within the application. Such issues impact customer trust, and when they aren’t addressed as a priority, it can be indicative of potential scale and performance bottlenecks for an org.
In this blog post, we’ll introduce a methodology that can help you analyze your application holistically. We’ll cover a high-level, theme-based remedial approach that developers can take to address their org’s performance and scalability issues.
Top-down analysis for an org
The approach described here is the “top-down analysis using single user assessment” approach that we introduced very briefly in the How to Scale Test on Salesforce series on the Salesforce Architects blog. It provides a detailed understanding of how a Salesforce app is performing at various application layers, such as the server layer or database layer. Using this methodology, you should be able to first get a holistic view of the entire application. Secondly, you should be able to break down the app into key components that are causing performance and scalability issues. You can then scale up applications better and quickly restore trust for customers.
The top-down analysis approach is comprised of three major steps.
Step 1: Application profiling & data collection
The first thing to do is perform “profiling” of an application using Single User Assessment. Profiling means executing an end-to-end business scenario, including navigating every action, refreshing pages wherever required, and collecting relevant data points.
The profiling approach described here lets you analyze an app running on Lightning Experience (LEX) and assumes that you are familiar with tools like Apex Log Analyzer and Salesforce Community Page Optimizer.
Let’s now look at how you can profile a sample hotel employee management application. This app shows the hotel employee details and allows a supervisor to create clusters of employees and assign duties to them each day based on demand. The app contains three tabs, where each tab contains three Lightning Web Components (LWC) components. The app is running into performance issues during peak season.
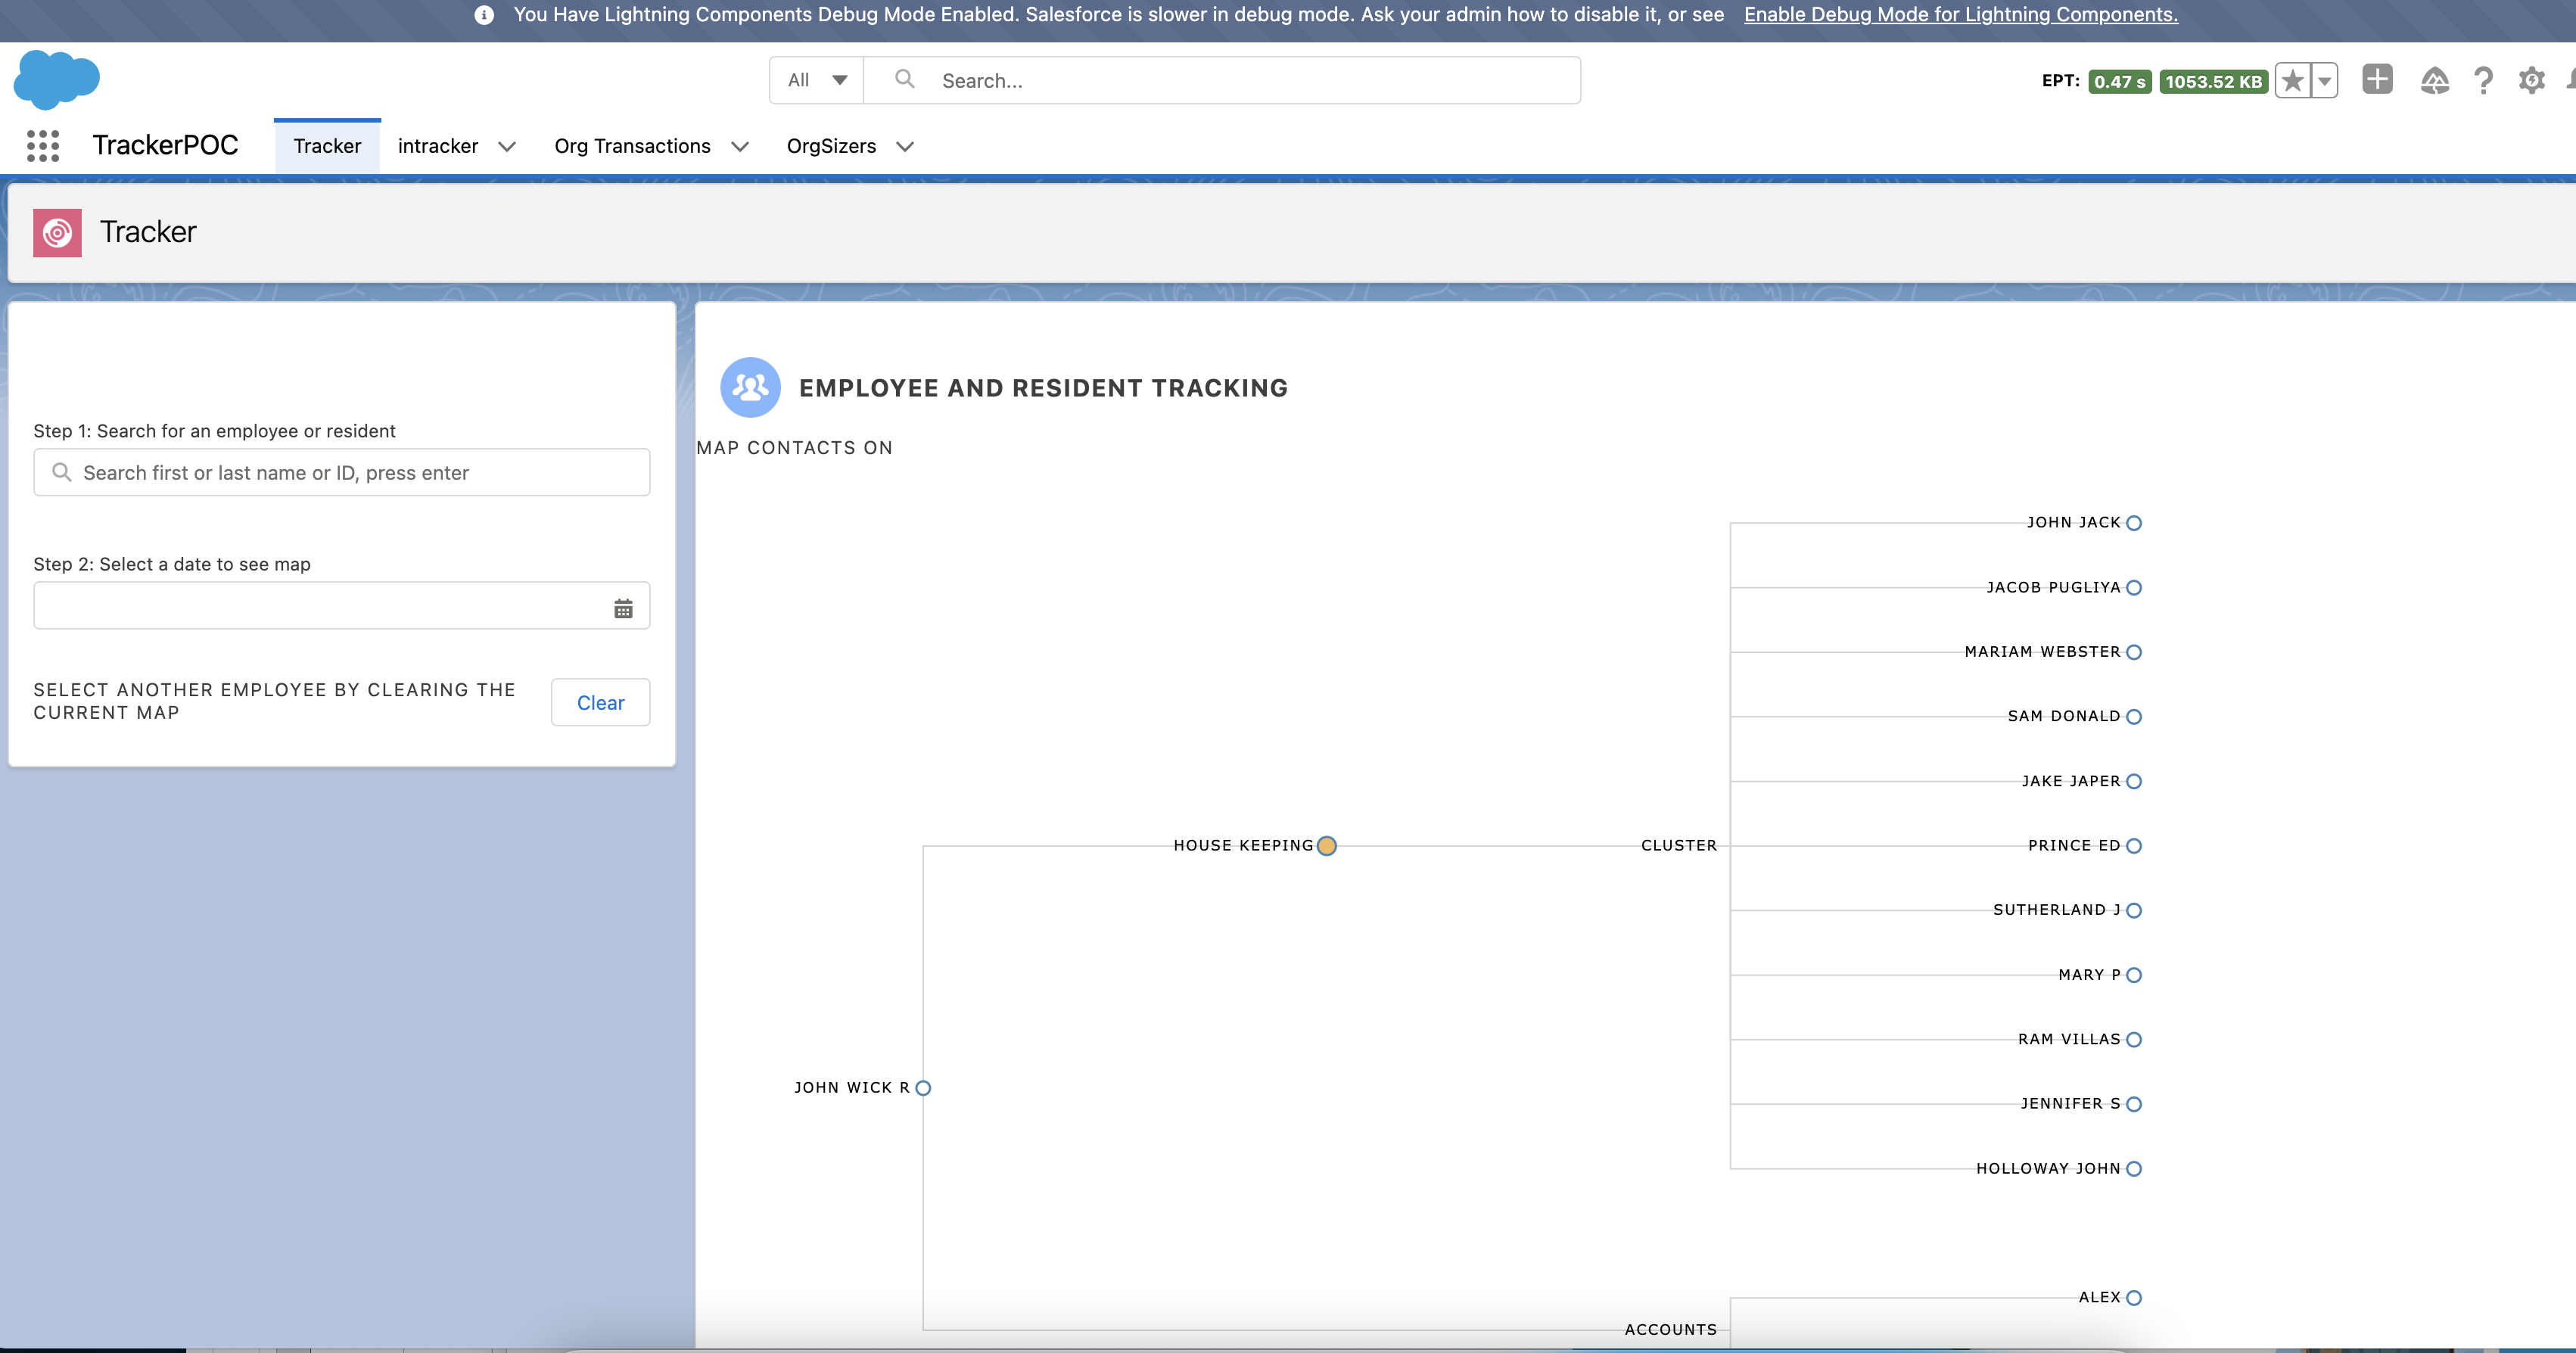
The first thing to do is enable debug mode for the user performing the business process execution. Secondly, install and enable the Salesforce Community Page Optimizer plugin. Finally, divide your business process lifecycle into multiple milestones; these can be associated with pages, components, or business-processes, whichever feels intuitive. For example, in our sample application, the lifecycle comprises different phases, such as searching for an employee, displaying the employee map/cluster, assigning tasks to employees, etc. Each of these phases can be a milestone during profiling.
Let’s start executing the first business milestone step of your application. In our sample application, the first milestone is to search for an employee using an LWC that shows a search box with type-ahead suggestions and a field to capture the date for which the duties and clusters have to be assigned. Once a milestone is executed, you can proceed to the Community Optimizer plugin extension to extract logs just for this one step. The first thing to gather from here are the XHRs (XMLHttpRequests) shown in the Insights tab.
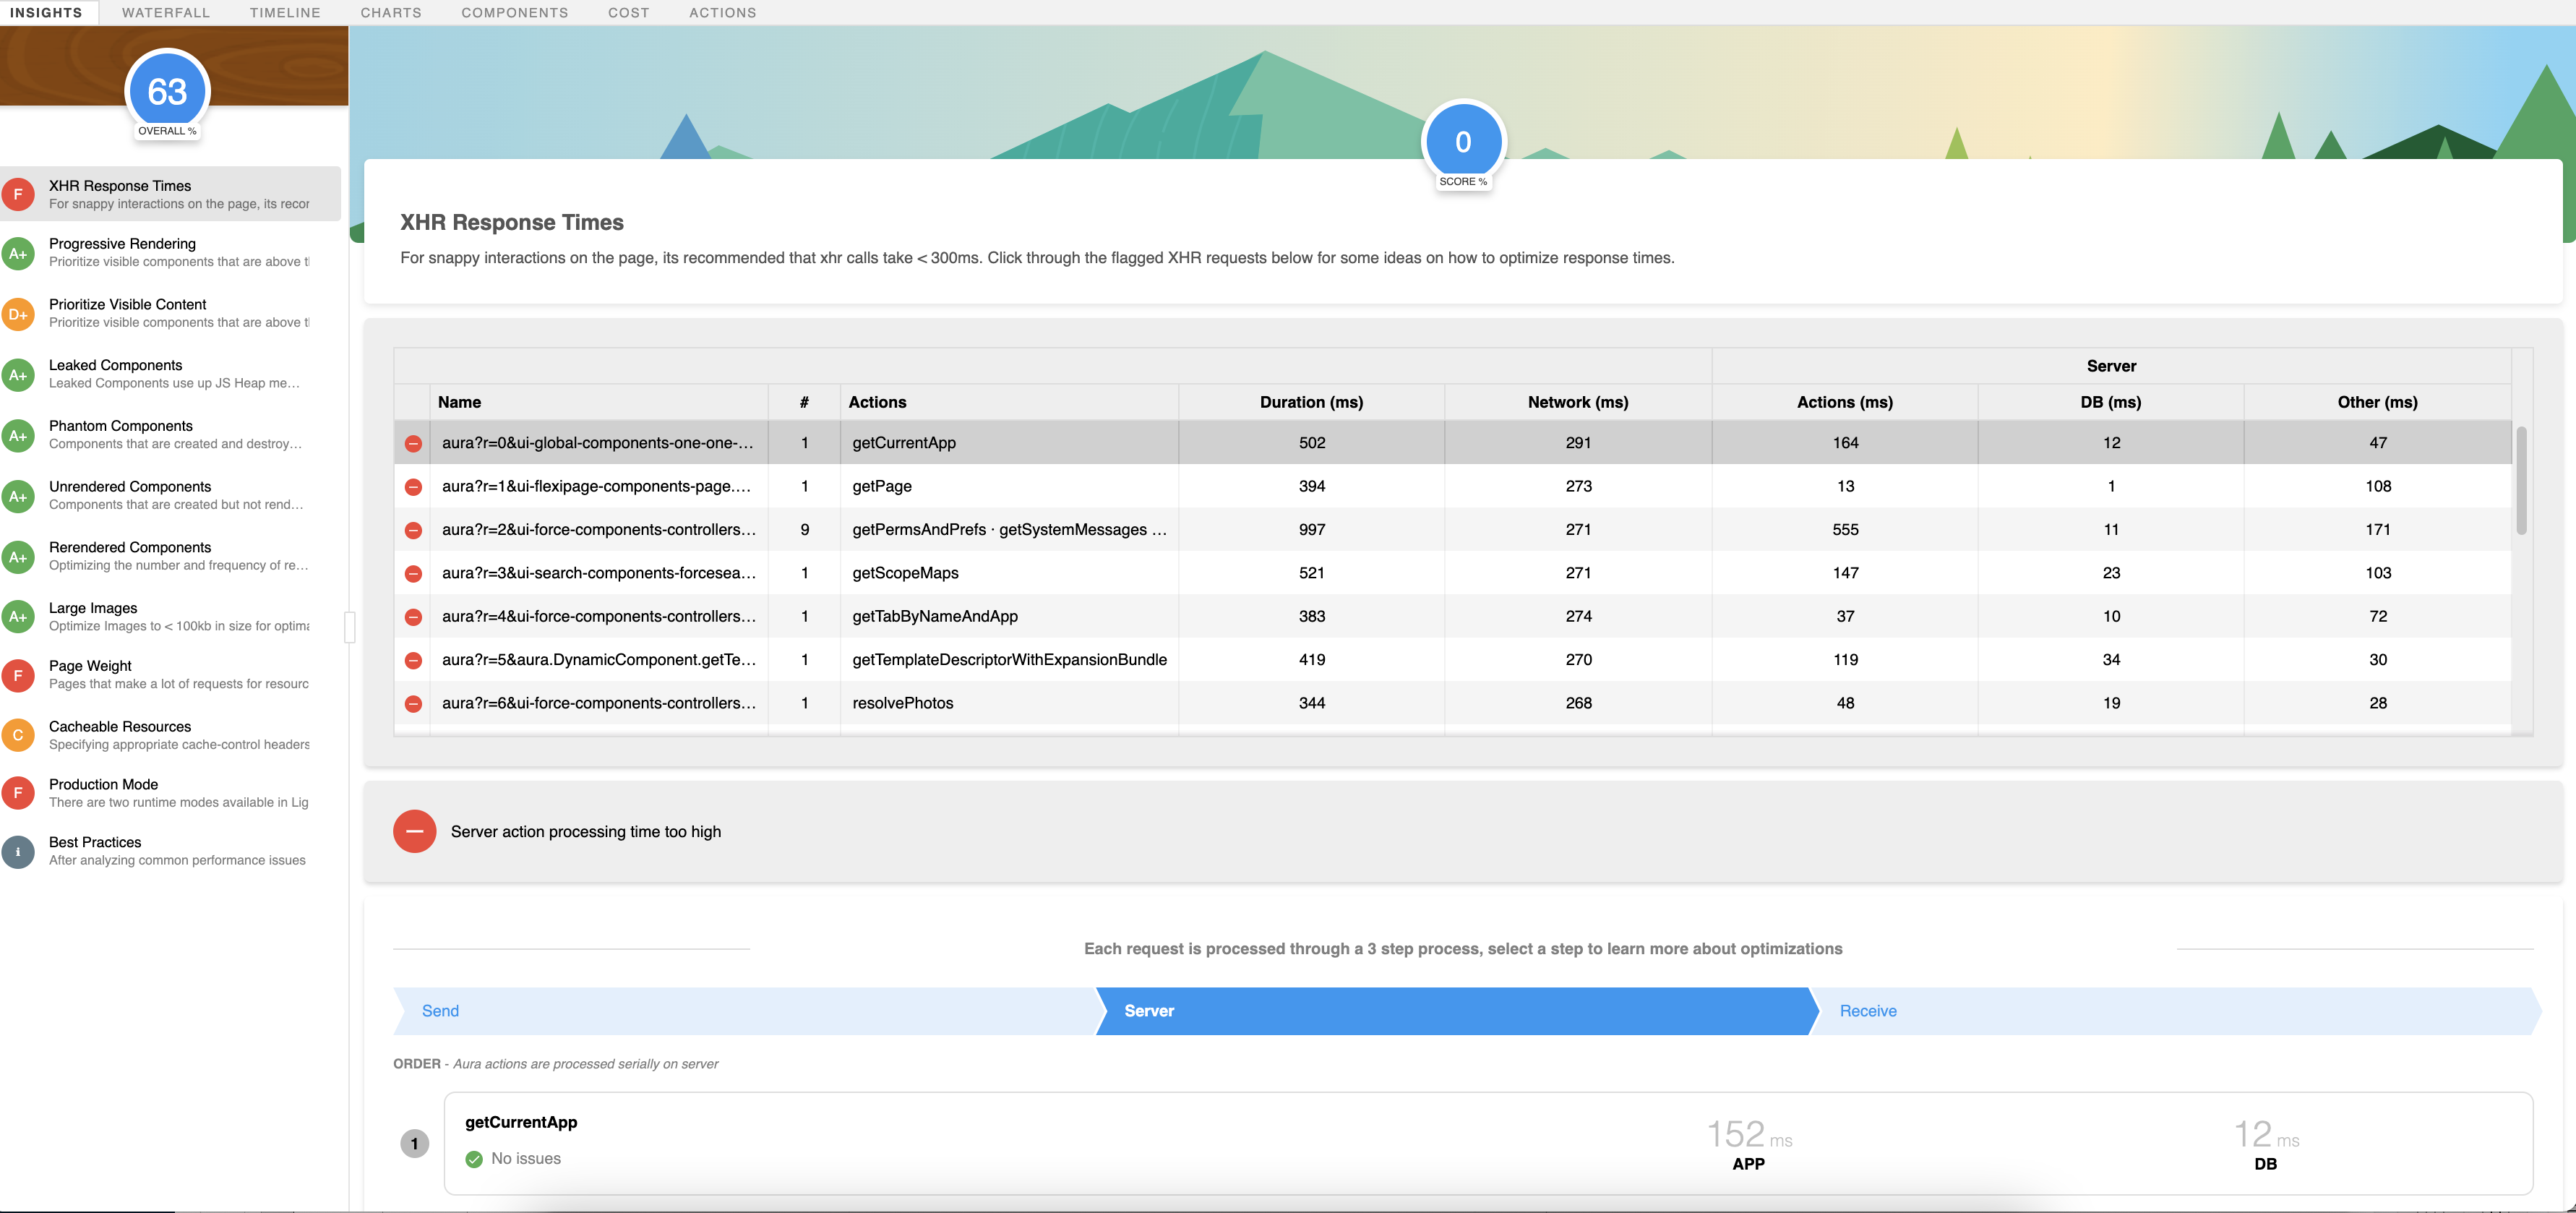
Use the templated spreadsheet below and capture the total XHRs with detail shown on the first page. This may seem a little obvious, but what this data set gives is a summarized view of total XHRs that have been invoked in the application. For the sake of brevity here, we have not added all the XHRs from the logs. Remember, it’s only profiling and data collection at this stage. Don’t start analyzing things just yet. We will do that once all the relevant profiler information has been collected.
| Metric | Server | |||||
| Name | # Actions | Duration (ms) | Network (ms) | Actions (ms) | DB (ms) | Other (ms) |
| aura?r=11&ui-search-components-forcesearch-sgdp.ScopesCache.getScopeMaps=1&auraXhr=true | getScopeMaps | 659 | 529 | 108 | 21 | 22 |
| aura?r=12&ui-setup-components-aura-components-gear.Gear.getGearSetupApps=1&auraXhr=true | getGearSetupApps | 583 | 527 | 29 | 12 | 27 |
Now that we have all the XHRs of this use case, we need to collect all actions that are in XHRs. For that, we will navigate to the Actions tab of the Optimizer plugin and download all the actions using the Export button. There is an Include Salesforce Actions checkbox; once checked, it will also give a list of all Salesforce-related backend actions that are being used to provide the layout of the page, fetch records, etc. For the purpose of profiling, you can keep the checkbox unchecked.

You can add the exported data to another tab of the sheet where XHRs were collected.
| name | duration | background | storable | abortable | serverTotalTime | serverDbTime | callbackTime | enqueueWait | controller | component |
| saveAvailableEmployeeList | 6185 | FALSE | FALSE | FALSE | 4985 | 944 | 15 | 0 | apex://AddEmployeeController_cc | c:AddEmployee |
| getRecords | 886 | FALSE | FALSE | FALSE | 190 | 47 | 27 | 0 | apex://SingleRelatedListController | c:SingleRelatedList |
Repeat the above two steps of collecting XHRs and actions for each milestone step of the application. Our application had three milestone steps inside it, so we should ideally have it collected at three stages. One caveat of using the Optimizer plugin is that it doesn’t automatically remove the actions from the previous steps. When profiling the app, you need to manually clear the list of actions after every milestone.
The following table lists all the actions across three milestones for the sample app. You can use this table as a template when profiling your own apps.
| name | duration | background | storable | abortable | serverTotalTime | serverDbTime | callbackTime | enqueueWait | controller | component |
| getTemplateDescriptorWithExpansionBundle | 422 | FALSE | TRUE | TRUE | 119 | 34 | 0 | 0 | aura://DynamicComponentController | none |
| getObjectInfo | 363 | FALSE | FALSE | FALSE | 21 | 0 | 0 | 0 | aura://RecordUiController | none |
| saveAvailableEmployeeList | 6185 | FALSE | FALSE | FALSE | 4985 | 944 | 15 | 0 | apex://AddEmployeeController_cc | c:AddEmployee |
| getNextEmployees | 1559 | FALSE | FALSE | FALSE | 487 | 160 | 28 | 0 | apex://AddEmployeeController_cc | c:AddEmployee |
| getRecords | 886 | FALSE | FALSE | FALSE | 190 | 47 | 27 | 0 | apex://SingleRelatedListController | c:SingleRelatedList |
| getRecords | 907 | FALSE | FALSE | FALSE | 136 | 30 | 20 | 0 | apex://SingleRelatedListController | c:SingleRelatedList |
| getNextEmployees | 849 | FALSE | FALSE | FALSE | 342 | 12 | 30 | 0 | apex://AddEmployeeController_cc | c:AddEmployee |
| getLayoutUserState | 337 | FALSE | FALSE | FALSE | 30 | 0 | 0 | 0 | aura://RecordUiController | none |
| getTemplateDescriptorWithExpansionBundle | 683 | FALSE | TRUE | TRUE | 234 | 33 | 0 | 0 | aura://DynamicComponentController | none |
| getRecordWithFields | 490 | FALSE | FALSE | FALSE | 134 | 24 | 0 | 0 | aura://RecordUiController | none |
| getRecordActions | 388 | FALSE | FALSE | FALSE | 69 | 18 | 0 | 0 | aura://ActionsController | none |
| getRecordAvatars | 486 | FALSE | FALSE | FALSE | 178 | 67 | 0 | 0 | aura://RecordUiController | none |
| updateMru | 385 | FALSE | FALSE | FALSE | 73 | 18 | 0 | 0 | aura://RecordMruController | none |
There are two important columns in this table. The ServerTotalTime column indicates total time in milliseconds that application servers and database servers took for them to complete processing the request. This does not include the time that it took for the request to go from the client to the application servers. The ServerDbTime column is purely the time spent on the database servers for the request to complete. Reading through the data for these two columns should give first-level clarity on where the time for most requests is being spent.
There is no specific baseline for metrics in individual columns since it depends on the nature of server-side actions. For example, an action that updates 50 fields on a bloated entity (a Salesforce object with a large data volume) will result in high database time against an action that queries for five fields with appropriate indexed filters.
With this, our data collection exercise is now complete.
Step 2: Data massaging
An enterprise application can be complicated, and therefore the above raw data of XHRs, actions, server time, etc. needs to be synthesized such that it is segregated into Business Case, Server Time, and DBTime. This helps you further split up and decode large applications.
Create the table below by collating the raw data collected in the previous step to understand what’s going on within the application. You can use this table as a template for your own apps. For our sample application, we are focussing on DBTime (ServerDbTime) to help us make sense of the entire application. In case DBTime is not a bottleneck, create this table using the ServerTotalTime of the application.
| Total DB Time(ms) | Business Usecase Name | Usecase DB time(ms) | Overall DB Time Contribution(%) | Stages of Application | Stages DB time(ms) | DB Contribution within usecase(%) | Overall db time contribution(%) | Phases within Stage | Phases DB Time(ms) | Contribution within Stages(%) | Overall db time contribution(%) | Actions | Component |
| 5880 | Employee Traceability | 5500 | 94 | EmployeeRetrival | 2800 | 51 | 48 | Landing | 34 | 1 | 0.6 | getNavigationMenu | forceCommunity:navigationMenuBase |
| GetEmployeeList | 1746 | 62 | 30 | getEmployeeData | c:AddEmployee | ||||||||
| GetRelatedEmployee | 1020 | 36 | 17 | getNextEmployees | c:AddEmployee | ||||||||
| EmployeeMapDisplay | 880 | 16 | 15 | EmployeeMapData | 278 | 32 | 5 | getRecords | c:MapEmployee | ||||
| DisplayMap | 602 | 68 | 10 | getLayoutUserState | c:MapEmployee | ||||||||
| EmployeeTracker | 2200 | 40 | 37 | UpdateEmployeeRecord | 1300 | 59 | 22 | UpdateEmployeeRecord | c:ActivityTracker | ||||
| RetrieveNextEmployee | 700 | 32 | 12 | getNextEmployees | c:AddEmployee | ||||||||
| DisplayActivityRecord | 200 | 9 | 3 | showActivity | c:ActivityTracker | ||||||||
| Integration Time | 380 | 6 | EmployeeIntegration |
Here is what each column of the table represents:
- Total DB Time: Overall DB Time across different use cases for which application data was collected
- Business Usecase Name: Represents the actual business use case name; this will be helpful in future steps
- Usecase DB Time: The time taken for the actual use case to complete
- Overall DB Time Contribution%: The percentage contribution of that specific use case with regard to the total time in the first column
- Stages of Application: The name of the stage or milestone of the application in that specific use case
- Phases within Stage: We can split each milestone to different phases. For example, in our sample application, the first milestone of searching for employees can be divided into phases like Landing (or page load), GetEmployeeList (or execution of search), etc.
- Actions: Represents the Lightning action name, which causes the specific contribution on server side
- We then have the actual database and server time (ms) contribution for that within the specific stage.
A developer or an architect of enterprise-grade applications should be able to understand this concept of stage and phases based on what’s applicable for their use cases.
This data then needs to be further simplified into the following structural tables to eventually bifurcate amongst the use cases and different stages of the application. This will then help us to understand the bottlenecks.
Bifurcation of overall application and DB contribution
| Phase Of Application | DB time(ms) |
| Login | 34 |
| EmployeeRetrival | 2800 |
| EmployeeMapDisplay | 880 |
| EmployeeTracker | 2200 |
Bifurcation of phases within application
| Phase Of Application | Sub Phase Within Application | DB Time of Sub Phase |
| Landing | NA | 34 |
| EmployeeRetrival | GetEmployeeList | 1780 |
| GetRelatedEmployee | 1020 | |
| EmployeeMapDisplay | EmployeeMapData | 242 |
| DisplayMap | 638 | |
| EmployeeTracker | UpdateEmployeeRecord | 1300 |
| RetrieveNextEmployee | 700 | |
| DisplayActivityRecord | 200 |
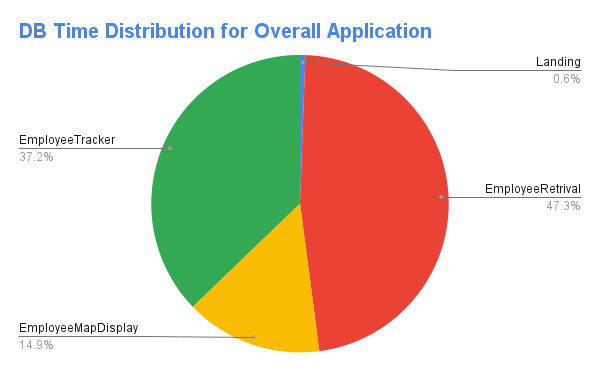
You can also visualize this data through a pie chart and drill down into each sub-phase to figure out where the maximum DB time is spent.

With all the data massaging done, it’s now time to analyze this data set.
Step 3: Data analysis
It’s time now to make sense of the data from the visualized representation above. The following interpretation can be made for the sample application:
- The Employee Retrieval Business step of the entire application takes 48% of DBTime
- Within this step, the GetEmployeeList sub-phase contributes 64% of the total time
- The Employee Tracker is the second highest business step, taking 37% of total DBTime
So, a developer or an architect needs to immediately focus on the GetEmployeeList sub-phase of the entire application for it to be more scalable. In this sub-phase, the specific Lightning action which contributes the most Server Time was already identified as part of data collection.
Now, the next question is: Within this action, which class and method is the actual culprit? Here is where the Apex Log Analyzer will come to your rescue. You can also instrument Apex code with logging using the Nebula logging framework and then determine troublesome queries and DMLs, etc. For the purpose of this blog, we will use Apex Log Analyzer. Turn on the Debug Logs with Finest Mode filter, re-run just the specific use case that triggers the action, and download the log to visualize it using the Apex Log Analyzer. Hover over the Database tab and look for the section where most of the time is being spent.

For example, if there is a query that’s taking significant database time (which can be identified from the Total Time column) then look for options to fine-tune the query.

If the action that’s taking time includes standard actions like UpdateRecord or SaveRecord, then related background operations like triggers and flows are the ones contributing to the increased database time. Now that we know the actions, exact SOQLs, and entry points of the code that are contributing to high database time, it is time to remediate these issues.
Remediation actions to be performed on analyzed data
Based on the analysis, there can be multiple avenues that a developer would need to take. We will categorize them into the following three high-level, theme-based approaches that you can take to resolve issues. There may be optimizations that fall outside of this theme, but these are beyond the scope of this blog post.
Theme 1: Read-intensive application remediation
If the optimization falls in this theme, where most time is spent in SOQLs with high database time, the following approaches can be taken:
- Evaluate all SOQLs in the READ path that can live with eventually consistent data and leverage Platform Cache for those SOQLs to reduce read cost. There are multiple examples mentioned in this blog that cover how and which scenarios can be useful for implementing Platform Cache.
- In your SOQL queries, remove any unwarranted fields or make them more restrictive. Explicitly filter out NULL values in the WHERE clause to allow increased query performance. Similarly, reduce the duration for the Date Time filter wherever applicable.
- The Lightning Platform Query Optimizer automatically indexes fields that it finds suitable for indexing periodically. However, there can be situations where the creation of a custom index might be the right fit to reduce database time. Reach out to support teams with appropriate data points to get a custom index created.
Theme 2: Write-intensive application remediation
If it’s a write-intensive application, and standard actions like UpdateRecord or SaveRecord are contributing to increased time, here are a few approaches you can take:
- Leverage the platform cache to reduce DB calls for subsequent reads within triggers
- Prevent recursions arising from cross-object DMLs and same-record field updates within triggers. Check out the Record-Triggered Automation guide to learn more.
- Identify and plan an archival strategy for objects with large data volumes (bloated entities). Bloated entities may lead to poor performance, slower reporting, or record locking, etc.
- Use a good trigger framework that is scalable, traceable, reusable, atomic and optimized. Check out Apex recipes to see a trigger framework in action.
Theme 3: LWC actions-related remediation
This theme of optimization can come up when it’s clear that data retrieval within LWC components in Lightning pages are driving high server times. There are some common anti-patterns for scalability of LEX applications, which includes incorrect usage of data retrieval, not enough data caching, badly implemented component initialization, and incorrect usage of force:refreshView or window.location.reload amongst others.
The Lightning Web Components Performance Best Practices blog post covers various performance optimization techniques in detail. However, here is a quick summary:
- Optimize calls to standard adapters like
getRecordorgetRecordUi. For example, when using thegetRecordwire adapter (see docs), request only the fields that the component requires, and avoid requesting a record by layout unless you absolutely need all that data. - Avoid reloading pages using
window.location.reloadduring normal workflows, as it causes unnecessary data retrieval calls due to application bootstrap. - Ensure that you are leveraging LWC’s built-in mechanisms for client-side caching, or build your own custom caching solution.
- Evaluate options to use Lazy instantiation or conditional rendering in your components to reduce the number of read requests during page load or subsequent operations.
- If
reportFailedActioncalls are dominating serverTime, it would mean that Experienced Page Time (EPT) for users is poor. While fixing thereportFailedActioncalls will not reduce overall DB load, it should improve the customer experience. It will also reduce the number of outstanding requests, and there are limits on how many requests each browser can have outstanding at once.
For detailed guidance on creating and designing Lightning pages that scale and perform, check out these resources:
- Lightning Web Components Performance Best Practices
- Maximizing Salesforce Lightning Experience and Lightning Component Performance
Conclusion
The methodology described here provides guidance on specific data that needs to be collected for profiling, as well as how to massage that data to gain insights into the application. It can provide a holistic view of any application built on Salesforce. This can then be leveraged as a starting point to demystify applications built on Salesforce and identify hot spots within them, allowing you to take appropriate remediation actions based on the theme that best applies to your application type.
About the author

Anand Vardhan is a Product Owner on the Performance Assistant Engineering team at Salesforce. He works on designing and developing product features required for scalable applications of very large and complex customer implementations to achieve business needs. Anand specializes in performance and scale engineering, server-side optimizations, Lightning, API design, data architecture, large data volumes, and caching. Anand can be reached on LinkedIn.