In enterprise application development, careful preparation and testing are crucial to ensure that your app can handle anticipated maximum loads. Salesforce Scale Test, a paid add-on, helps simulate production traffic in a full-copy sandbox to prepare for peak user loads. Developers previously struggled to understand the current system’s infrastructure limits, which hindered their ability to plan workload execution effectively. Now, there’s a new tool to help you discover scalability issues in your Salesforce applications.
In this post, we’ll present the newly released Test Health Report feature in Scale Test and show you how it addresses these challenges by helping users determine Request Per Second (RPS) throughput variances during test planning, thus streamlining the process.
Overview of the Test Health Report in Scale Test
The Scale Test service identifies bottlenecks, optimizes performance, reduces downtime, and ensures a seamless user experience during high-demand periods. It involves creating test plans, scheduling test slots, and running tests for performance insights.
The Test Health Monitoring system in Scale Test brings transparency into scale testing with:
- Real-time reporting on load, limits, and saturation
- Predictive insights into how much more throughput can be safely added
- Self-service analysis that reduces dependency on engineering intervention
It aggregates the back-end metrics of various infrastructure components, including database, App, Async Queues, etc, and maps them to org-level test performance in an easy-to-consume, customer-oriented report.
The problem we’re solving
In multitenant Salesforce environments, developers face several barriers when testing scalability:
| Challenge | Impact on Developers & Architects |
| Lack of infra-specific platform-level metrics | Difficult to predict when infrastructure is nearing capacity |
| Post-mortem monitoring | Bottlenecks found only after the fact |
| Manual intervention | Delays due to back-and-forth with support teams |
| Lack of guided reporting | Inconsistent test results and missed optimization opportunities |
This often leads to infrastructure throttling, availability impacts, and long feedback cycles.
Why it matters to developers
What makes Scale Test unique is how it abstracts the complexity of Salesforce’s multi-tenant infrastructure while still giving developers the levers they need, including:
- Scalable throughput without internal details: You get capacity insights without needing to understand the intricate back end
- Business-defined metrics for self-qualification: Reports are mapped to meaningful, measurable org-level outcomes
- Actionable remediation: You can identify critical implementation gaps (e.g., inefficient Apex, misconfigured tests) and resolve them early
With Test Health Monitoring, Salesforce Developers and Architects can design better tests by ensuring realistic load, diagnose bottlenecks faster in Apex or infrastructure, plan with confidence by knowing exact scalability remaining, and shift left to catch issues early instead of relying on post-mortem debugging.
Architectural flow of the Test Health Report
Here’s a high-level view of how Test Health Monitoring integrates into a Salesforce scale test:
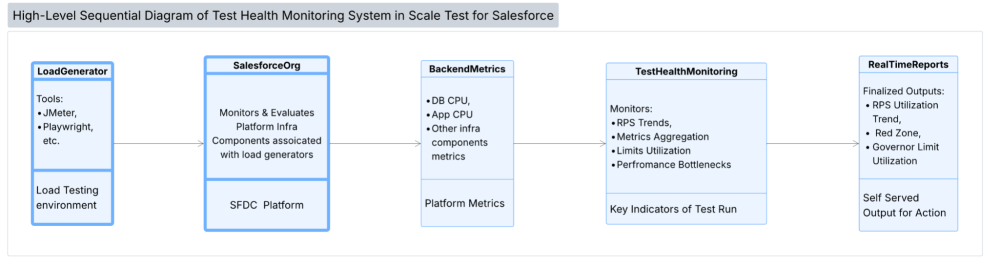
The process starts when the load generator adds load to the Salesforce environment, which then looks for key platform metrics internally, such as database utilization, app servers utilizations, and async message queue utilizations. It then intelligently determines using an algorithm based on past usage trends and the current usage trends from the load. It also extracts the back-end, system-generated events to calculate hotspots and trends at a high level. All of these are cumulatively presented back to the user as a report for further action.
Test Health Monitoring
For developers, the Test Health Report provides crucial insights into application performance under load. It details overall metrics like throughput, stability, and efficiency while also offering granular data on governor limit proximity, identifying Apex performance bottlenecks, and giving early warnings when an organization approaches saturation.
Let’s now look at each section of the report one by one.
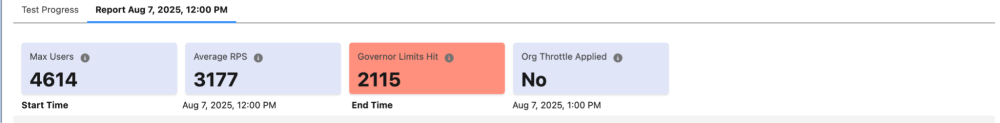
Request Per Second (RPS) section
The RPS Trends feature is the first section of the report offering more than just historical data. It proactively displays “Live Achieved vs. Planned RPS,” allowing users to monitor in real time whether their test is achieving the intended load. This provides crucial insight into whether the planned throughput was successfully reached during the test with the current user load.
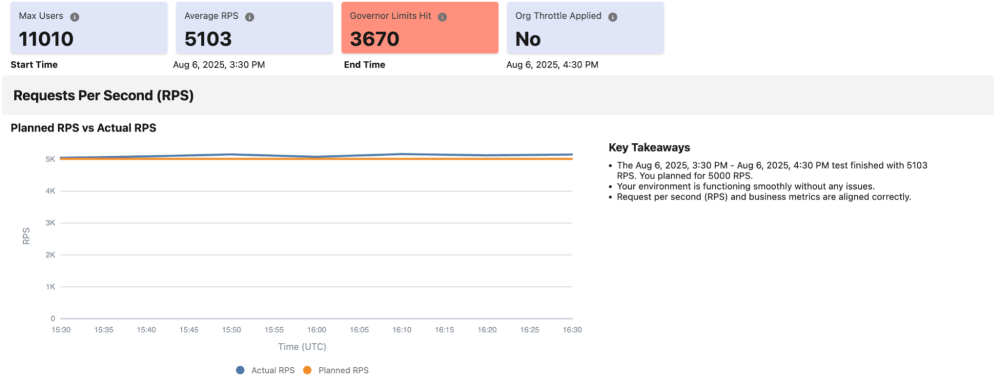
The next section is extremely important and details the RPS projection on the basis of the number of users that were added in the current load simulation. This one chart alone tells users the following three dimensions of the current load.
- Remaining Scalability Buffer: Compares current metrics against 30 days of p90 utilization to calculate safe headroom.
- Red Zone Indicators: Displays a red zone within the chart that indicates when you’re approaching infra saturation. Essentially, the Red Zone indicator serves as a crucial warning, signaling to users that they should cease increasing the load to avoid overstressing the infrastructure.
- Coefficient of Variation: Detects volatility in request patterns, pinpointing unstable or spiky load behavior.
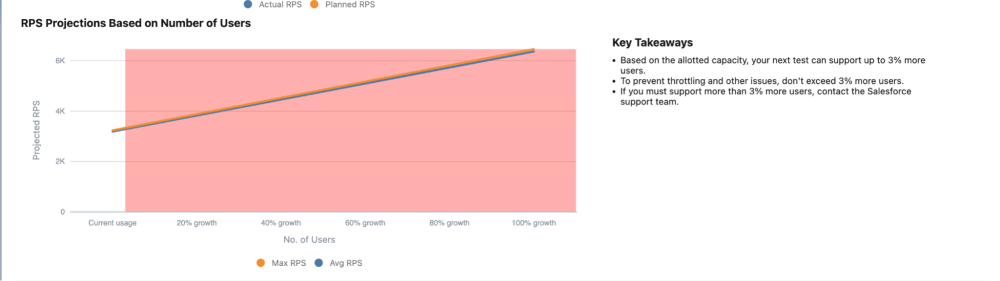
Lets take this as an example: a case management workload designed for 100,000 cases/hour with 20,000 users. The current simulation, however, with only 11,000 users (as shown in the chart), indicates that the system will not support more than 3% of the current throughput load, highlighting a potential bottleneck. Therefore, we are intelligently letting users know that on the current setup, the performance team should first look for all possible errors to be fixed and then rerun the load. If it’s still insufficient, then they can reach out to Salesforce support for further assistance on back-end infrastructure scale.
Similarly, if the red line starts from 40% growth, it would indicate that no more than 40% of the current throughput should be inserted into the current setup to have a smooth testing experience.
This kind of visibility allows you to decide: “Should I keep scaling this test, or am I about to saturate my org?”
This shifts capacity planning from reactive troubleshooting to a proactive scaling strategy.
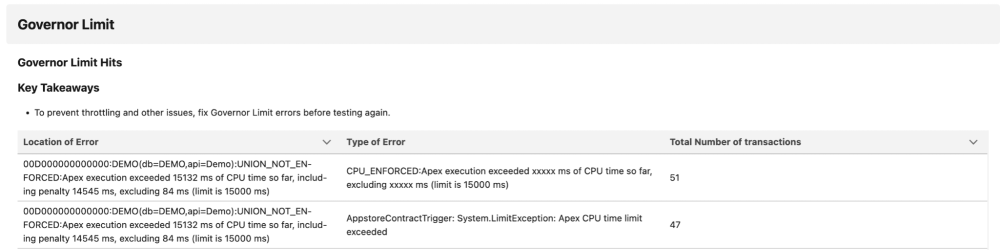
Governor Limit section
Apex runs in a multitenant environment. The Apex runtime engine strictly enforces limits, so that runaway Apex code or processes don’t monopolize shared resources. If some Apex code exceeds a limit, the associated governor issues a runtime exception that can’t be handled. It is crucial to address governor limits before increasing throughput. Failure to do so can lead to undesirable outcomes, such as throttled requests or HTTP 503 Service Unavailable errors.
The screenshot below shows the governor limit-related errors in this section.
Apex Summary section
The report then focuses on the tech stack, showing where time is consumed during all Apex transactions. This helps identify the layer that requires tuning. For instance, significant time spent on the database indicates that optimizing SOQL and DML statements within the identified entry points is the recommended next step to mitigating runtime slowness.
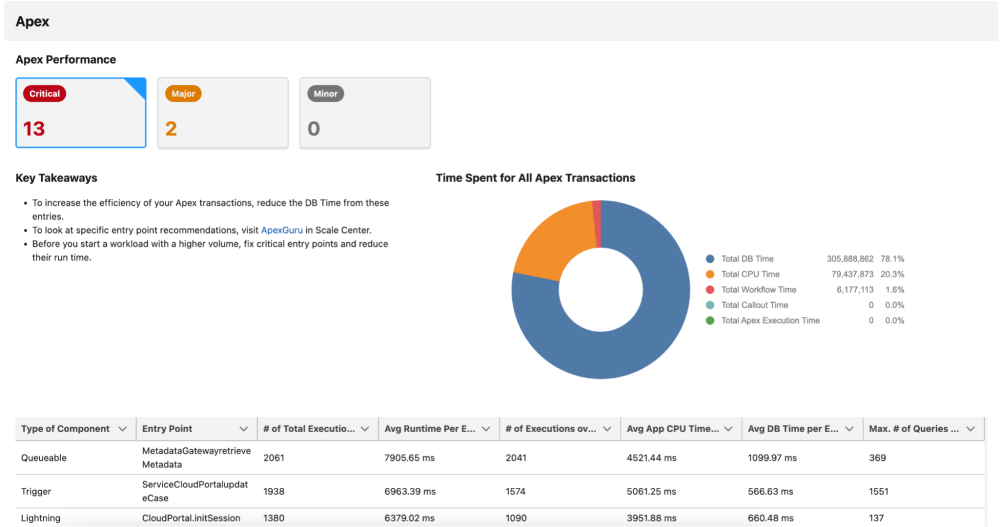
Below the time distribution widget, the Test Report surfaces the top entry points running for the duration of the scale test. An algorithm analyzes entry points based on their count and runtime, categorizing them as Critical, Major, and Minor to help prioritize optimization efforts. The table details subsequent actions that users can undertake. Each row also highlights the dominant stack for each entry point in red. This indicates that for each entry point, the columns highlighted in red are the areas requiring fixes to reduce the overall runtime of those entry points.
Taken together, these elements offer a complete picture of the ongoing Scale & Performance test. Architects and developers overseeing the test are expected to address issues and implement necessary actions after each test execution.
Conclusion
Scale Test and Test Health Monitoring are redefining how we approach performance at scale in Salesforce. As these capabilities evolve, developers and architects will have even more proactive tools to ensure that their applications are robust, scalable, and future-ready. Start by running your next scale test with RPS Trends enabled. Use the insights to tune your test design, monitor for red zones, and make data-driven decisions about scalability. With these tools, scale testing on Salesforce is no longer guesswork — it’s engineering with foresight.
Learn more at Dreamforce 2025
If you’re registered to attend Dreamforce on October 14-16, check out the following to learn more:
- Attend the Developer Keynote in person or watch on Salesforce+
- Reserve your seat in the Test Your Agents and Deploy with Confidence session
- Reserve your seat in the Real-Time Agent Performance Monitoring for Success and Architect’s Guide to Building Reliable Agentforce Solutions breakouts
- Check out the Scalability Booth in the Platform Park at Moscone West
Resources
- Blog post: Your App Shouldn’t Panic in Rush Hour Traffic – Here’s How to Prepare
- Trailhead: Scale Test: Quick Look
- Blog post: Load Test on the Salesforce Platform Using Scalability Products
- Blog post: How to Scale Test on Salesforce
About the Author
Anand Vardhan is a Product Owner for the Scalability Products team, helping customers develop scalable solutions on the Customer 360 platform. Anand designs features for Scale Center and Scale Test products. His background includes performance and scale engineering, server-side optimization, Lightning, application design, caching, and managing large data volumes. Follow Anand on LinkedIn.