In the world of Salesforce engineering, a SOQL query is the heartbeat of your application. But as any architect of an org with significant processing or large data volumes knows, not all SOQL queries are created equal. You might have a perfectly formatted query that passes every linting test, yet still brings a production pod to its knees during peak hours.
Historically, tools for addressing this challenge have relied on top-down analysis — scanning Apex metadata to find suspicious patterns. Today, we are unveiling a bottom-up revolution: Database Insights in Scale Center.
The “runtime reality” gap
Traditional performance analysis tools suffer from a runtime reality gap. They look at your code repository and say, “This query uses an indexed field; it’s fine.” But enterprise-grade applications live and breathe dynamic SOQL, where the query isn’t fully built until the moment a user clicks a button.
Static scanners are blind to the bind variable values — the actual data passed into your filters at runtime. Without knowing these values, it is impossible to distinguish between a selective success and a table-scan terror:
- Selective success: Your query uses an index to jump straight to the 10 records you need out of millions. It’s fast, efficient, and keeps your org snappy.
- Table-scan terror: This occurs when the database engine cannot use an index and is forced to look at every single record in a table to find a match.
Architect’s tip: Think of a table scan like trying to find a specific quote in a 500-page book by reading every single word from page one, rather than using the index at the back to jump to the right page. When your table grows to millions of rows, these scans cause CPU timeouts and slow down the entire platform for your users.
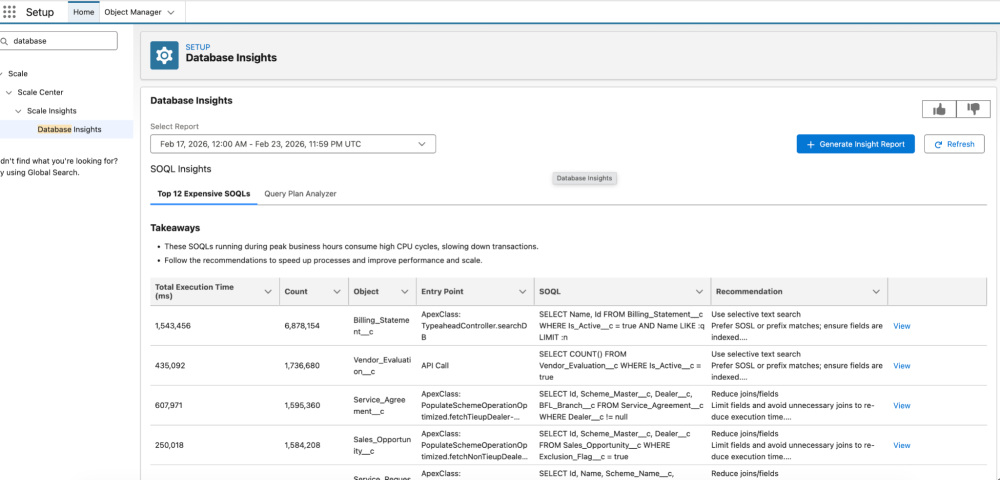
Navigate to Database Insights from Setup >> Scale Center >> Database Insights.
Engineering the bottom-up approach
Database Insights turns the traditional model on its head. You don’t guess which queries are slow; you start where the performance impact is actually felt: the database. This is a three-step process.
1. Identifying the heavy lifters
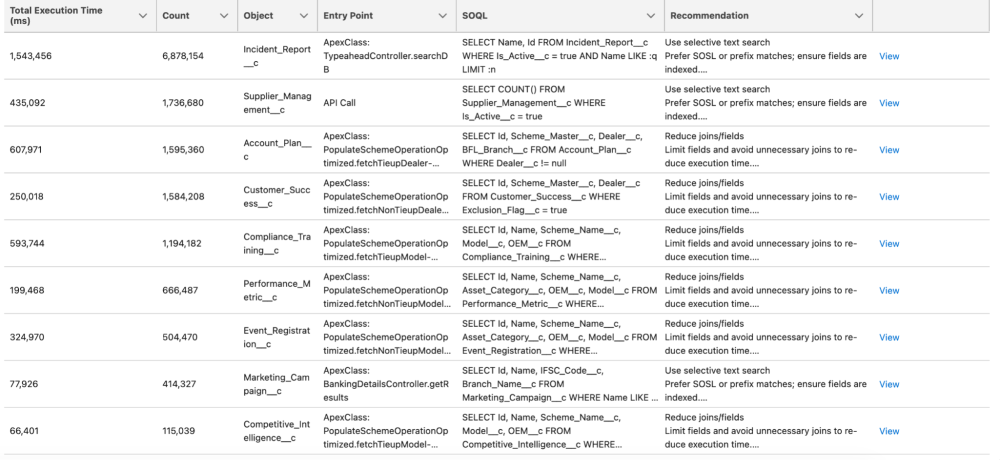
Instead of analyzing every line of code, with the bottom-up approach you identify the specific queries driving resource consumption during your most critical business windows. Think of it like a database administrator using standard system views (similar to open-source equivalents like pg_stat_statements). You isolate the queries that dominated CPU usage during your org’s peak performance hour, helping you identify the specific code causing the most friction.
2. Intelligence-driven reconstruction
A raw database execution looks very different from the Apex you wrote. Our platform uses a sophisticated mapping engine to bridge the gap between runtime database activity and your source code:
- Context discovery: The system automatically filters out system overhead to focus exclusively on your custom logic.
- Traceability: The system correlates database activity back to its origin — whether that’s a specific Apex class, Flow, or report.
- Bind-value awareness: It captures the actual bind variable values passed to the database. Knowing a query failed because of a NULL filter can be the difference between a guess and a guaranteed fix.
3. Execution-plan analysis
Once the query has been reconstructed by the mapping engine, it is analyzed by the Database Insights optimization engine. By evaluating the actual database execution plan — the same way an expert uses an EXPLAIN command — we generate surgical recommendations based on that execution plan for the query.
Case study: The dynamic predicate problem
Consider a common pattern: a utility class that fetches records based on dynamic filters.
1public static List simpleBindingSoqlQuery(Map<String, Object> bindParams) {
2    String queryString =
3        'SELECT Id, Name ' +
4        'FROM Account ' +
5        'WHERE name = :name';
6    return Database.queryWithBinds(
7        queryString,
8        bindParams,
9        AccessLevel.USER_MODE
10    );
11}
12
13String accountName = 'Acme Inc.';
14Map<String, Object> nameBind = new Map<String, Object>{'name' => accountName};
15List accounts = simpleBindingSoqlQuery(nameBind);
16System.debug(accounts);
A static scanner inspects the Apex code and reports that the query passes all checks — it uses bind variables, is sanitized, and shows no obvious flaws. In reality, during peak traffic, Scale Center identifies this method as a top CPU consumer because the runtime data exposes issues that static analysis cannot see.
Example: The non-selective null
A UI component accidentally passes a null value into the filter. The reconstructed SOQL becomes:
SELECT Id, Name FROM Account WHERE name = null
Since NULL values are rarely indexed effectively in large datasets, the engine scans millions of rows in a full table scan. Scale Center flags this as a high-CPU query, notes that the filter ‘Name’ is receiving null values, and provides the recommendation: add a null-check in the Apex controller before execution to prevent NULL values from reaching the query.
Example: The polymorphic date bloat
A report generation tool builds a query with a wide date range. The reconstructed SOQL is:
SELECT Id FROM Case WHERE CreatedDate = LAST_N_DAYS:365 AND Status = 'Closed'
In this case, the database performs an index skip scan. The combination of a broad date range and a low-cardinality status field forces the database engine to examine far more rows than necessary. Scale Center identifies this high CPU usage and recommends narrowing the date range to 30 days or including the Status field in a composite index to improve selectivity.
Comparing static analysis and Database Insights
The following table shows how a traditional static Apex parser differs from Database Insights across visibility, complexity, performance, and context.
| Feature | Static Apex Parser | Scale Center Database Insights |
| Visibility | String templates only | Final string + actual bind values |
| Complexity | Struggles with concatenation | Captures exact SQL sent to engine |
| Performance | Best-practice guesses | Measures actual CPU milliseconds |
| Context | Blind to table volume | Analyzes the execution plan to understand true query cost and selectivity |
How to use Database Insights results
When you open Database Insights, don’t focus only on the SOQL string. Look at both the “SOQL” and the “Recommendation” columns to identify the actual queries and suggestions for how to improve them.
A game changer for architects and developers
If you are managing a large-scale implementation, Database Insights in Scale Center provides unique capabilities that are not available through static analysis alone.
First, it enables impact-based prioritization. You aren’t investigating and fixing 100 “maybe” slow queries. You are fixing the top 15 queries that actually consumed the most CPU during your busiest hour last week. Second, it supports infrastructure stability. By optimizing these expensive, suboptimal SQL queries, you aren’t just helping your users; you are also protecting the pod’s availability and reducing the risk of concurrent request limit exceptions.
Database Insights is not just another dashboard. It is a bridge between the database optimizer and the Apex developer. By analyzing how queries are executed and providing targeted recommendations and providing a library of fixes, we are moving from passive monitoring to actionable, data-driven recommendations.
About the author
Anand Vardhan is a Product Owner for the Scalability Products Team, helping customers develop scalable solutions on the Customer 360 platform. Anand designs features for Scale Center and Scale Test products. His background includes performance and scale engineering, server-side optimization, Lightning, application design, caching, and managing large data volumes. Follow Anand on LinkedIn.