
Agent Platform Tracing captures every Agentforce action execution as an OpenTelemetry trace tree stored in Data 360, giving you a queryable record of every LLM call, flow execution, and Apex invocation in the chain. A single user utterance to an agent can trigger a cascade of downstream calls, and when you need to understand exactly what happened, a top-level error message rarely tells the full story. The actual issue (a slow LLM step, a misfired flow, an Apex class that never returned) is buried somewhere in the execution chain. Agent Platform Tracing surfaces that chain as a hierarchical tree showing what happened, how long each step took, and where the chain broke.
The feature is based on the OpenTelemetry standard and stores all span data directly in Data 360, making it queryable alongside the rest of your org’s data with a single toggle flip.
How to enable Agent Platform Tracing
Enabling Agent Platform Tracing takes about two minutes:
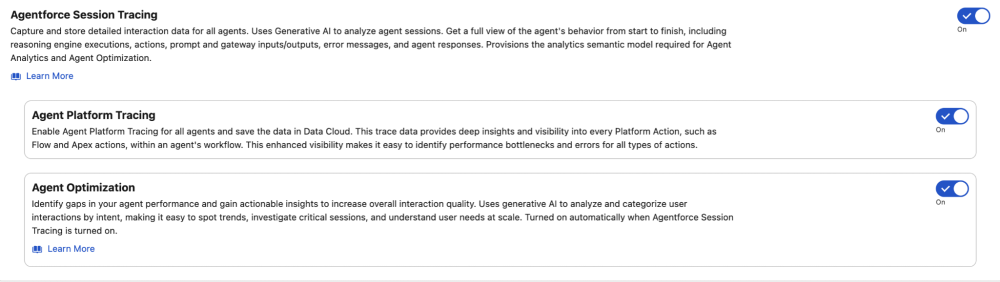
- Toggle it on in Setup. Navigate to Setup → Agent Platform Tracing and flip the toggle to enabled. This starts writing span data to Data 360 for every Agentforce action execution in your org.
- Verify Data 360 is provisioned. Agent Platform Tracing stores spans in data model objects (DMOs), so your org needs Data 360 provisioned and active. If you’re already using Agentforce, this is likely already in place.
- Check permissions. Users querying trace data need the Data Cloud Data Access permission set, plus read access to the ssot__TelemetryTraceSpan__dlm and related DMOs.
- Wait for data. Spans begin populating within minutes of the first Agentforce action execution after enablement. There’s no backfill of historical data.
Once enabled, trace data is queryable via SOQL against the Data 360 DMOs described in the sections below.
How Agent Platform Tracing builds a trace tree
The core concept of Agent Platform Tracing is straightforward: each instrumented service that is called when an Agentforce action executes generates a telemetry record called a span, and every span records its parent’s ID. That parent-child chain lets you reconstruct the execution sequence as a hierarchical tree, from the root interaction down through the instrumented downstream calls.
Here’s what that looks like in practice. The following trace shows an agent action executing a flow that results in an error:
1[OK] run.interaction (96afcfefaa6fbfe9) — 2,430ms
2└── [OK] run.llmstep (9939b8bc33d12bfa) — 167ms
3    └── [OK] run.topic.FlowAgentforce__FlowBuilderAutomationsTopic — 3ms
4        └── [OK] run.llmstep (b3595456464fbe93) — 1,341ms
5            └── [ERROR] run.action.Get_Account_179SB000000v31B — 481ms
6                ├── [OK] run.invokeActions.FLOW — 274ms [InvocableAction]
7                │   └── [OK] run.Get_Account.1 — 266ms [Flow]
8                │       Attributes: flow.api.name=Get_Account, flow.api.version=1,
9                │                   flow.execution.api.version=Spring '26,
10   |                    flow.type=AutolnchNoTrig
11                │       └── [OK] run.createrecord.account — 42ms [Flow]
12                │           Attributes: db.collection.name=Account, db.rows_affected=0,
13                │                       db.operation.name=query
14                └── [OK] run.llmstep (b4e5194e749ede24) — 884ms
A few key things to call out here: the ssot__DurationNumber__c field (e.g. 2,430ms) tells you how long each step took, and ssot__StatusCode__c (Status is always either OK or ERROR) tells you exactly where a chain broke.
Note that the flow ran successfully — run.Get_Account.1 returned OK — but the parent action still errored. The reason is in the span attributes: db.rows_affected=0 tells you the Account query returned nothing. Despite the operation being named run.createrecord, the db.operation.name=query attribute reveals it was actually performing a lookup, not a write, and that lookup came back empty. The action expected a result and didn’t get one. Execution continued anyway with a fallback run.llmstep, which is why the overall interaction didn’t terminate immediately.
Without the span attributes, you’d see a failed action and have no idea whether the flow ran, whether it touched the database, or what it found there.
Comparing Agentforce session tracing and Agent Platform Tracing
Agent Platform Tracing stores spans into Data Lake Object (DLOs) which get mapped into Data Model Object (DMOs) using the single source of truth (ssot) prefix. Before going further, it’s worth understanding how Agentforce sSession Tracing and Agent Platform Tracing differ.
| Feature | Level | Captures | Primary DMO | Join Field |
| Session Tracing | Planner | Conversational flow: user input, subagent routing, agent response | ssot__AiAgentInteraction__dlm | ssot__TelemetryTraceId__c |
| Platform Tracing | Service | Back-end execution: LLM calls, Flow runs, Apex invocations, timing, errors | ssot__TelemetryTraceSpan__dlm | ssot__TelemetryTrace__c |
Agentforce Session Tracing — centered on ssot__AiAgentInteraction__dlm — is instrumented at the planner level and captures the conversational flow: what the user said, which subagent handled the request, and what the agent returned. Agent Platform Tracing, via ssot__TelemetryTraceSpan__dlm, is instrumented at the service level and captures the back-end execution state that powered that response. The span DMO is self-referential by design: ssot__TelemetryParentSpanId__c maps back to ssot__Id__c, enabling tree traversal from any node in either direction. Furthermore, because both DMOs share the exact same underlying Trace ID, you can join ssot__TelemetryTraceId__c directly to ssot__TelemetryTrace__c. This enables you to connect Agentforce session tracing to the specific back-end code execution provided by Agent Platform Tracing.
Querying trace data with SOQL
With SOQL, you can query these DMOs directly via the API to extract exactly the diagnostics you need. A good starting point is profiling performance by operation type, which quickly surfaces any parts of your agent execution that are consistently slow:
1SELECT ssot__OperationName__c,
2       AVG(ssot__DurationNumber__c) AvgDuration,
3       MAX(ssot__DurationNumber__c) MaxDuration,
4       COUNT(Id) SpanCount
5FROM ssot__TelemetryTraceSpan__dlm
6WHERE ssot__StartDateTime__c > 2026-01-01T00:00:00Z
7GROUP BY ssot__OperationName__c
8LIMIT 20
Or we can query for all recent spans that have errors:
1SELECT ssot__Id__c, ssot__OperationName__c, ssot__TelemetryTrace__c,
2       ssot__StartDateTime__c, ssot__DurationNumber__c, ssot__StatusCode__c
3FROM ssot__TelemetryTraceSpan__dlm
4WHERE ssot__StatusCode__c = 'ERROR'
5ORDER BY ssot__StartDateTime__c DESC
6LIMIT 20
Or count errors across operation types:
1SELECT ssot__OperationName__c, COUNT(Id) SpanCount
2FROM ssot__TelemetryTraceSpan__dlm
3WHERE ssot__StatusCode__c = 'ERROR'
4GROUP BY ssot__OperationName__c
5LIMIT 20
Once we find a span we want to investigate, we can query for all related spans via ssot__TelemetryTrace__c:
1SELECT ssot__Id__c, ssot__OperationName__c, ssot__TelemetryParentSpanId__c,
2       ssot__ServiceName__c, ssot__StatusCode__c, ssot__DurationNumber__c,
3       ssot__StartDateTime__c, ssot__EndDateTime__c,
4       ssot__TelemetrySpanAttributeText__c
5FROM ssot__TelemetryTraceSpan__dlm
6WHERE ssot__TelemetryTrace__c = 'YOUR_TRACE_ID'
7ORDER BY ssot__StartDateTime__c ASC
We can then reconstruct the tree client-side by matching each span’s ssot__TelemetryParentSpanId__c to another span’s ssot__Id__c, treating null or 0000000000000000 as the root.
Query Agent Platform Tracing data from Slack with Slackbot
Because this data lives in Data 360, you can easily query the data to observe Agentforce. One effective pattern is wiring instructions into a Slack canvas, feeding it to Slackbot, and using it as the natural language interface for our trace data. This makes it easy for anyone to digest the trace information, as long as Slackbot is set up to query the information correctly. Whether you’re responding to a user complaint or proactively checking for errors, the workflow is the same: ask the bot, get the trace tree, pinpoint the issue, and discuss a fix, without ever leaving Slack. No log spelunking, no guesswork. Just a conversation with Slackbot to find the root cause and come up with a potential solution.
The approach I take when providing instructions to Slackbot is simple: I provide the schemas, sample queries, join patterns, and main use cases. You can find some of the instructions I use in my Agent Platform Tracing Slackbot Instructions GitHub repo.
You’ll need to make sure that your Slack is connected to an org that has Agent Platform Tracing enabled. Once you do, just add the instructions for Slackbot into a canvas and either add the canvas as a tab for Slackbot or paste it into the chat at the beginning of your conversation.
Here’s a typical Slackbot exchange:
1You:  Why did interaction b9e8f7b4 take 4 seconds?
2
3Slackbot:  I queried all spans for trace b9e8f7b4. The interaction
4           took 2,690ms total. Here's the breakdown:
5
6           run.interaction           2,690ms  OK
7           └─ run.llmstep              139ms  OK
8              └─ run.topic               3ms  OK
9                 └─ run.llmstep        838ms  OK
10                    └─ run.action      327ms  OK
11                       └─ run.llmstep 1,011ms  OK   ← slowest span
12
13           The bottleneck is the final run.llmstep span (1,011ms),
14           which accounts for 38% of total duration.
Once you have Slackbot set up with Agent Platform Tracing, you can ask things like:
- Why did this agent interaction take 4 seconds?
- Which subagent is responsible for the most errors this week?
- What are the most common errors for a given operation type?
- What’s the root cause of this issue that a user is asking about?
Joining Agentforce Session Tracing and Agent Platform Tracing data
With the right instructions, Slackbot can query and join both Agentforce Session Tracing and Agent Platform Tracing data together. Joining them provides a full trace tree for end-to-end observability of Agentforce. With both features, we have complete visibility of agent activity and issues in a couple of minutes.
Use this when you want to correlate a user’s conversational context (Agentforce Session Tracing) with the back-end execution details (Agent Platform Tracing). This is an optional advanced use case; both features work independently.
How the join works
Because ssot__TelemetryTraceId__c on ssot__AiAgentInteraction__dlm matches ssot__TelemetryTrace__c on ssot__TelemetryTraceSpan__dlm, they can be used for a direct join. This means you can fetch all spans for an interaction in a single query.
Full joined hierarchy
1Session (ssot__AiAgentSession__dlm)
2└── Interaction (ssot__AiAgentInteraction__dlm)
3    └── Step (ssot__AiAgentInteractionStep__dlm)
4        └── Span (ssot__TelemetryTraceSpan__dlm)
5            └── Span (ssot__TelemetryTraceSpan__dlm)
6                └── ...
Query pattern: Get all spans for a known interaction
1SELECT ssot__Id__c, ssot__OperationName__c, ssot__TelemetryParentSpanId__c,
2       ssot__StartDateTime__c, ssot__DurationNumber__c, ssot__StatusCode__c
3FROM ssot__TelemetryTraceSpan__dlm
4WHERE ssot__TelemetryTrace__c = 'TELEMETRY_TRACE_ID_FROM_INTERACTION'
5ORDER BY ssot__StartDateTime__c ASC
Getting started
Generative AI adds complexity to modern stacks that traditional logging wasn’t designed to observe, and the cost of those blind spots compounds the longer they take to find. Agent Platform Tracing removes the blind spots. And, when you combine it with Slackbot, it is far easier to observe, troubleshoot, and fix Agentforce issues in production so your agents can get back to work without issues. Check out the Agent Platform Tracing Slackbot Instructions GitHub repo for working Slackbot instructions that you can copy-and-paste into a canvas to get started, and the Agent Platform Tracing documentation for setup instructions and the full data model reference.
Trevor Scott is a Senior Manager of Product Management at Salesforce, focused on enabling customers with security and telemetry data to help developers and admins ship more confidently.


![[Agentforce ハンズオン] Coral Cloud Resorts サンプルアプリケーションのご紹介](https://d259t2jj6zp7qm.cloudfront.net/images/20240918152858/Sample-App-Blog.png?w=1905)
