Sometimes the simplest tips are the best. It always surprises me how many people forget about the System Log Console. This innocuous little link at the top of your Salesforce screen is a gem for debugging code snippets or tracking code execution. With the Spring '10 introduction of customizable filters, things just got a whole lot better! Here are a few quick tips to help you speed the time you spend debugging code in the app.
Let's start by executing a code snippet using the System Log to check the size of the number of Accounts I have in my org. After typing my code and clicking execute, I can click on the latest log line item to drill into the debug to see the result of my little test. (and better still, I can go back to previous logs without jumping back to a previous screen)

Cool huh? By itself, the System log is extremely helpful: I tested my code snippet, and quickly found the line of debug I wanted.
But what happens when I have a LOT of other activities in my system? My log messages might get lost amid the other output statements being written to the log. This is where Filter Settings really help.
Let's use our same Apex Statement, but this time click "Show Filter Settings" at the top of the System Log. You will be presented with a Filter Details section where you can control what log messages are displayed when. A good tip I like to do when debugging some complex Apex code, for example, is to set all of the Category levels to "NONE", except for Apex. Now execute our snippet again, click the log, and see the difference:
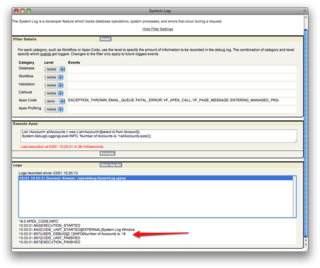
Much neater isn't it? We can see just the information we want quickly, and easily. The nice thing is that, after playing with Filter levels, clicking the Reset button will return the Filters to their default values Keep in mind too that setting the Filters through the System Console effect the logs accessible via Setup | Administration Setup | Monitoring, not just the System Console.
With the ability to filter log levels across categories, a best practice for development I typically follow is to add business related log messages using the LoggingLevel.INFO static variable throughout my application (I use LoggingLevel.DEBUG–the default log level if you do not specify anything in your System.Debug statement–for development time checking only, and remove these statements before pushing my code to production). Then when I have a piece of code that appears to be functioning incorrectly, I can quickly filter my logs, narrow in on the offending section of code, and determine if, indeed, I have an error.