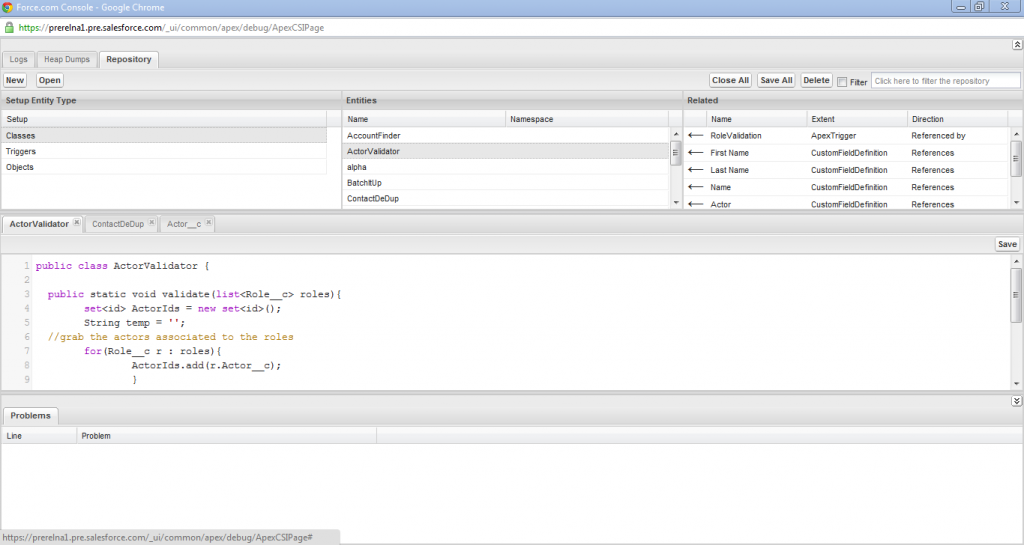
 As much as I love Eclipse (and use it as my primary Force.com development environment), my laptop doesn’t always have the 1 Terabytes of RAM that Eclipse sometimes seems to require. Its therefore great to have the option of developing and debugging in the browser and in fact many believe (including myself) that browser based IDEs are the way of the future. In that vein, Winter ’12, the latest release of Salesforce.com that is slated to rollout later this month has some great enhancements to what used to be called the System Log. The System Log has now been renamed the Developer Console and its a fitting name given how much debugging, analysis and even development you can now do in that window. The new Developer Console (accessed as before from the <Your Name> link in your Force.com Org) has a brand new ‘Repository’ Tab (see screen shot above) where you can view, edit and even create new Apex classes and Triggers and view all the standard and custom Objects in your Org, all from a single browser window. There is also a new ‘Heap Dumps’ tab where you can browse snapshots of the state objects in memory at the time of capture, including references between objects, and the view variables in more detail than offered in the System Log view (e.g. you can view individual items in a List variable). You can of course still view the detailed system logs via the ‘Logs’ tab, but its now truly a ‘Developer Console’ and not just a place to view system logs.
Dave Carroll and yours truly will be hosting a webinar in a couple of weeks previewing this and other cool developer features of the Winter 12 release, including Visualforce Charting and native JSON support in Apex. Make sure you tune in to that.
p.s. To enable the new Developer Console in Winter ’12, open the System Log by clicking ‘<Your Name>–>System Log’ and then click on the ‘Try it now!’ link to enable the new console.