Guest post: Peter Knolle is a Solutions Architect at Trifecta Technologies, Force.com MVP, and Salesforce Developer Group Organizer. He holds six Salesforce certifications, blogs regularly at peterknolle.com, and is active on Twitter @PeterKnolle.
 The client-side functionality of Lightning components is implemented with JavaScript which runs in the browser or through the Salesforce1 app, so tools that are available for debugging Apex are not available. Don’t worry, though. There are some very good tools available and the Lightning Component framework provides some handy JavaScript APIs to facilitate debugging. This post explores the different methods for debugging Lightning Components.
Setting up Client-side Debugging of Lightning Components
Most web browsers provide a set of web developer tools. Google’s Chrome has Chrome Developer Tools. Apple’s Safari has Web Inspector. Microsoft’s IE has F12 Developer Tools. I used Google Chrome for this post.
The JavaScript can be debugged using the browser’s tools which means that you’ll want to launch the app in the browser and not the native app in the phone. If you are debugging a Lightning Application (app) you can just launch the app from the Salesforce Developer Console by clicking the Preview control in the app bundle or you can navigate directly to the URL in your web browser, e.g., https://<yourInstance>.salesforce.com/c/MyOppListing.app. If you need to debug within the Salesforce1 app you can navigate to the browser app of Salesforce1 at https://<yourInstance>.salesforce.com/one/one.app. You can even debug something directly on a phone by setting up remote debugging and navigating to your app’s URL or the /one/one.app URL in your mobile browser.
The framework should be run in debug mode so that a readable version of the JavaScript is used. This can be enabled by checking the Enable Debug Mode checkbox in the Lightning Components setup page.
A Lightning Component to Debug
Consider a component that loads a list of Opportunity records owned by the current user that are in a stage specified as the stage attribute on the component. On initialization the component queries the server to get a list and then writes out some basic information about the Opportunities as well as some details from the primary Contact on the related Account, if there is one. It could be used as <c:opps stage=”Negotiation/Review”/>.
Let’s look at problems that could have happened while developing this Lightning Component and how they could have been addressed using capabilities of the framework and browser tools.
Using the JavaScript Debugger in Lightning Components
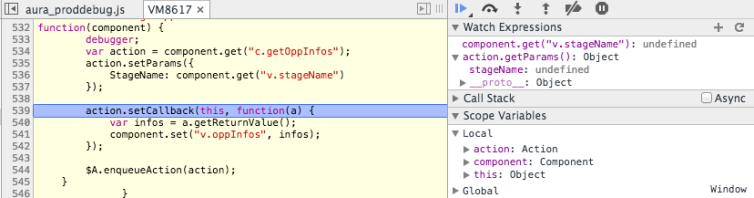
On the initial load, the list of Opportunity information objects was not loading at all and nothing was displaying. I was confident in the Apex code and determined that there must have been something wrong in the component bundle’s JavaScript. The code that calls the server-side action in the Apex controller to get the list resides in a helper method that gets the action, sets the parameters, defines the callback, and enqueues the action.
The browser’s JavaScript debugger can be used to interactively step through the component’s JavaScript line by line. The simplest way to set a breakpoint is by inserting a debugger statement on the line on which you want your code to stop. A good spot to insert it in the getOpps function was right at the beginning.
Once the breakpoint is hit, you’ll be able to step through your code and inspect the values of different variables. I suspected that the stageName value might not be retrieved correctly, so I added in some watch expressions. A watch expression is arbitrary code that you write in the debugger that is evaluated when the debugger is paused. I was able to check the value of the stageName attribute and for good measure, I also added a watch expression for action.getParams(). Both showed the stageName as undefined.
I found that the issue was that the component attribute was declared in the component markup as stage, whereas the JavaScript code attempted to get the v.stageName value. No such attribute was defined, so the result was undefined. I changed the JavaScript code to get the v.stage and the server-side action then completed, but still nothing was returned.
Client-side Logging in Lightning Components
When the action completes, its callback is called and the action itself is passed into the callback as the argument. There is a getState() method on the Action object that can have different values, one of which is “ERROR” if an error occurred. Additionally, there is a getError() method that returns an array of errors with messages. I modified the helper to check the state of the action in the callback and log the error.
I made the change, ran the code again and saw…nothing in the browser’s console. What’s going on? The $A.log method does not log messages to the console by default. You need to write your own handler and subscribe to whatever log level you are interested in handling. I added the following code to do that.
If I wanted to I could have subscribed to “ERROR”, but then I would have needed to log at the “ERROR” level with something like $A.logger.log(“ERROR”, “callback error”, a.getError()). Inspecting the error in the log, I saw that there was an internal server error. The Apex controller I thought was solid had something wrong with it after all and I needed to debug it.
Server-side Debugging of Lightning Components
The solution for server-side debugging is to use debug log capabilities just as you would normally do with Apex code outside of the Lightning Component framework. The Salesforce Developer Console is a great tool for inspecting information that has been written to logs. When using the Salesforce Developer Console look for logs that have a value of /aura in their Operation column. I did this and saw that there was a logic error that was causing a null de-reference error. After writing a unit test for it (of course!), I fixed the code, verified my unit test passed, and the component worked as expected.
More
For more information on debugging in the Lightning Component Framework, refer to the Lightning Component Developer’s Guide. For a quick overview and introduction to Lightning Components, visit the Lightning Components page on Salesforce Developers. If you’re ready to learn hands-on while earning badges to demonstrate your skills, start the Lightning Components module in Trailhead.