Charts are used to compress large quantities of data and make relationships within data easier to comprehend. They can be read more quickly than raw data and are an essential part of storytelling using data. Wave Funnel is one such chart type; it succinctly communicates the health of any deal pipeline.
Funnel Charts
Funnel is one of the most ubiquitous charts used on sales dashboards where it is used to depict deal flow. It is typically used to visualize the progressive reduction of data as it passes through various phases of a business process. Besides Sales, it can also be used to:
- Analyze the results of marketing and promotional campaigns
- Understand user’s actions on a website
- Identify bottlenecks in an order fulfillment or a procurement cycle
- Evaluate candidate flows during recruitment
Just like other Wave charts, the Wave funnel utilizes tweening (inbetweening) and morphing effects to provide strong visual cues about the changes as a user slices and dices their data. The stem (the lowest part of funnel) of the funnel also adjusts in proportion to the measurement of the statistical variable by stages assigned to it. These features make gleaning insights very natural and obvious.
Using a Basic Wave Funnel
A simple funnel is not very different from a single bar stacked-bar chart where the size of a slice indicates the volume of that stage and its relation to the other stages in that stack.
To create a simple Wave funnel chart in Explorer, select a measure like sum of amount and group by Stage. Clip this lens to your dashboard and change chart type to funnel. Alternatively, use the following SAQL to power your Wave funnel chart.

Basic Wave Funnel
Unlike a stacked bar, the order of stages is important in a funnel chart. An easy way to set order is to name stages with a preceding number to indicate its order in the list. For example: “0-Lead”, “4-Closed Won”, etc. This can be done in the source data or using computeExpression action in the dataflow. If desired, labels can be changed from “0-Lead” to “Lead” in the user XMD. More information on XMD key labels can be found in the Extended Metadata (XMD) Reference.
Funnel with a Wave Twist (Time’s arrow)
Wave funnel charts allows us to set one or more stages in the stem. Typically one would set the won stage(s) in the stem. However, since currently, we can only set the number of stages in the stem, the query needs to ensure that it always returns a row for the won stage(s), even when there are no data for that stage. In the latter case, the value would be 0.
Since Wave allows for dynamic exploration, it would be fairly common to get into a state where there are no records for the won stage(s) and a pattern described here would have to be implemented to avoid confusing the user.
The query below assumes that you have set “# of stem segments” as 1 in the widget properties as follows:
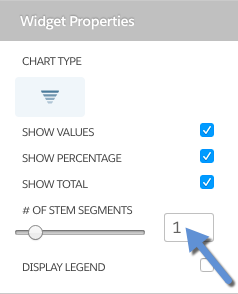
Wave Funnel Widget Properties
If you want more stage segments to show up in the stem then adjust this number and the query accordingly.

Wave Funnel Over Time
To summarize, if you decide to use a stem then you should write a custom SAQL query to
- Restrict stages that get displayed in the cone and the stem.
- Ensure (Won) stage always shows in the stem.
Stages of the Future-Past
Some businesses report their pipeline as a forward-looking metric versus closed/won deals as a lagging/trailing indicator. It is fairly easy to use a custom SAQL query to achieve this.
Happy Wave Surfing…
Wave funnel can succinctly convey the state of your business pipeline. Combined with ad-hoc slicing and dicing of data, the Wave funnel chart can give you a quick snapshot of the health of your business. A short stem as you approach end of quarter could be a sign of weak conversion that requires attention. This could be a possible indicator of over commitment, unexpected seasonal shortcomings, or a need to shift focus.

Wave Funnel Examples
For more Analytics Cloud developer resources please visit https://developer.salesforce.com/page/analytics.
About the Author
Kaushik @kaushforce Ruparel is a Director at Salesforce Analytics Cloud and works at the leading edge of Wave. He is dedicated to providing architectural advice and best practices for everything Wave and is passionate about Analytics and Charting.
Kaush is a member of the Analytics Cloud’s Advanced Solutions Group.
About the Advanced Solutions Group (ASG)
A specialized analytics team in the Analytics Cloud product organization that provides world-class technical leadership and guidance focused on empowering the Wave ecosystem. ASG helps drive rapid value by leveraging deep technical knowledge of the Wave platform and apps.