 Does your salesforce.com implementation involve running reports or generating dashboards for a base object that has tens of millions of records? Do you have reports that aggregate data from more than one object? Or are your users’ dashboard refreshes timing out? This blog post will give you an overview of how to design reports for large data volumes (LDV).
Report and Dashboard Performance Tuning
To improve your report performance tuning, and in turn make your reports and dashboard requests run faster, you can apply the LDV and SOQL performance optimization best practices outlined in Best Practices for Deployment with Large Data Volumes.
Here’s a high-level checklist of those best practices. Most of them are relatively easy to follow when you design your reports.
- Narrow the scope of your reports with filters (e.g., for time range or record ownership) and split your reports if possible.
- Add selective filters to your reports.
- Place custom indexes on filtering fields. (Contact salesforce.com Customer Support for help with this).
- Avoid adding unindexed, unselective filters when you have OR conditions.
- Deselect Show | Details in report builder for summary reports and reports that are used for dashboard components.
- Remove unnecessary fields from your reports.
- Schedule your reports (i.e., use asynchronous processing).
- Implement event notifications instead of constantly refreshing dashboards to drive business workflow.
- Set dashboards to run as specified users with the “View All Data” permission instead of dynamically as logged-in users to reduce the data access calculation overhead.
- Archive data regularly.
- Empty your Recycle Bin regularly.
Architectural Approaches for Reporting on Large Data Sets
Although the previous best practices can help you tune your reports, you might not be able to implement some or all of those best practices because of your business requirements. For example, if your CEO wants a year-to-year sales performance comparison for all sales records, you won’t be able to use selective filters to narrow the scope of your report. And if your organization’s data growth rate is faster than its data archiving rate, it will cause the base object’s data size to grow over time. As a result, you might have reports and dashboards that take a long time to complete, or in some cases time out altogether.
Here are some architectural best practices that many of our customers have adopted to report on large data sets.
Denormalization
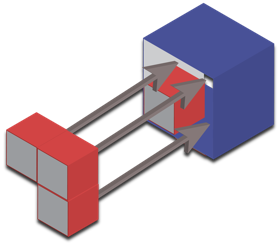 If your report is based on multiple objects, and you need to report on fields that reference other objects, those fields will cause the underlying database query to join multiple objects. If you don’t use selective filters and indexes, these joins can quickly add to your performance costs. A great example is including a non-deterministic formula field that contains a reference to another field from a related object. Instead of having to derive a report’s values from referenced objects, you can statically store their values in the base object itself by using workflow rules and Apex triggers. This denormalization technique can help the underlying database query execute much faster by avoiding joining multiple objects.
If you take a deeper dive into our multitenant architecture, you will learn that, even if you are querying from a single object, you are actually joining tables at the underlying database level. Skinny tables are similar to the previous denormalization technique in that they use a single, combined table to avoid the overhead of joining multiple database tables. For extreme cases, even following performance tuning best practices may not resolve your performance issues, and you might want to contact salesforce.com Customer Support to see if a skinny table would be a good fit for your business requirements. (To learn more about skinny tables and when you might want to request them, read Long- and Short-Term Approaches for Tuning Force.com Performance.)
Pre-Aggregation
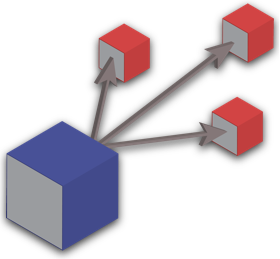 The pre-aggregation approach decouples massive aggregation calculations, reducing their scope by splitting them into smaller, more manageable calculations. For example, you can use batch Apex to store the calculations’ intermediate aggregations in a special type of record or in a separate custom object so that you can base your reports on that record or object, not on a record total that might run in the tens of millions.
You can pre-aggregate vertically, horizontally, or both. For instance, if your sales organization is divided into geographic regions or by sales products, you might want to pre-aggregate horizontally. Alternatively, if it has a well-defined organizational structure, you might want to pre-aggregate vertically, which could involve staggering the aggregation by rolling up record totals at the team level first, and then at departmental levels after that.
You should store and reuse aggregated results. For example, if you calculate last year’s sales figures based on the closed deals for each of that year’s months, you can reuse each month’s totals whenever you refresh your historical sales performance dashboard—this historical data probably won’t change. Pre-aggregation can save you a lot of performance overhead, especially if you can refer to the pre-aggregated data instead of the bucket fields in your reports.
The idea is to narrow the scope of your report and divide it into intermediate sub-reports. This best practice not only helps each of the divided jobs complete faster, but it also allows you to run the jobs in parallel. To compensate for not being able to drill down into your sub-reports’ record-level details from your dashboard, you can give users access to those sub-reports, each of which contains one of your pre-aggregated data sets.
Hybrid Approach
Needless to say, the previous two approaches have similarities. You can combine these approaches, which serve the same goal: to avoid running a request that runs through tens of millions of records from multiple objects.
Caching Considerations
When we look at our customers’ implementations, we sometimes find report and dashboard refreshes that have been set up to run regularly so that the cache can stay “warmed up.” Although it is true that Force.com uses caching mechanisms under the hood to boost query performance, you should not rely on these mechanisms to solve your performance issues. The cache pool is shared across organizations in Force.com’s multitenant architecture, is used by many types of transactions, and does not guarantee that any data will persist.
Summary
If you are designing reports or dashboards that require aggregating millions of records, and need to go beyond traditional performance tuning best practices, consider using the denormalization, pre-aggregation, or hybrid architectural approaches.
Related Resources
- Best Practices for Deployments with Large Data Volumes
- Database Query & Search Optimization Cheat Sheet
- Making your Reports Run Faster
- Maximizing the Performance of force-com SOQL, Reports, and List Views
- Architect Core Resources
About the Author
Daisuke Kawamoto is an Architect Evangelist within the Technical Enablement team of the salesforce.com Customer-Centric Engineering group. The team’s mission is to help customers understand how to implement technically sound salesforce.com solutions. Check out all of the resources that this team maintains on the Architect Core Resources page of Developer Force.