Have you heard that logging is repetitive or indecipherable? At first glance, logging might be intimidating, but thanks to the Developer Console Log Inspector, you can turn even the longest logs into poetry – or whatever you want.
This post shows how to use the Developer Console Log Inspector (Summer ’13) to view and filter logs, and includes a simple example. Please share your own poetry!
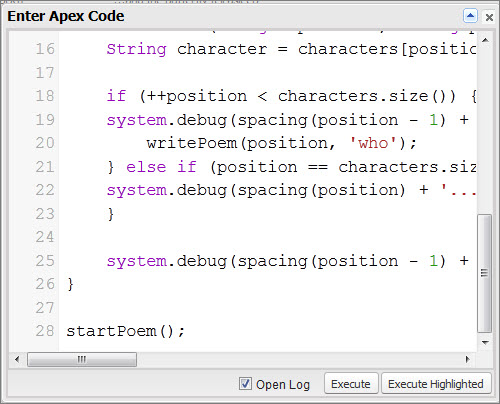
In the Developer Console, click Debug > Open Execute Anonymous Window (or Ctrl/E) and enter the following Apex code:
List<String> characters = new List<String>{'child', 'little white dog', 'little green frog', 'butterfly'};
String spacing(integer num) {
String spacing = '';
for (integer i = 0; i < num * 5; i++) {
spacing += '_';
}
}
void startPoem()

{

    writePoem(0, 'A child');

}
void writePoem(integer position, String prefix)

{

    String character = characters[position];
if (++position < characters.size())
}
}
   system.debug(spacing(position - 1) + '...and the ' + character + ' fell asleep');

}
startPoem();
Select the Open Log option and click Execute.
The log opens in the Log Inspector, in the Log Only perspective. At first, it includes a bunch of limits information and system messages:

The options at the bottom of the panel allow you to filter the messages displayed. Select Debug Only and watch poetry happen:

You can still use the Developer Console to debug and troubleshoot – new Log Inspector features make that even easier. For example, click Ctrl/P to select from the available log panels and create custom perspectives. (In this image, the Execution Log panel is not available because it is the only panel selected and you can’t have a perspective without any panels.)

For more information on the Log Inspector and log perspectives, check out the Developer Console online help – it’s updated and improved too!