Bind columnMaps in Dashboard Interactions
You can bind the columnMap parameter in a dashboard widget and in the widget section of your queries. Binding is useful when you have multiple measures or groupings and you want to control the order in which they're selected and portrayed in a chart.
This example shows how to bind the columnMap parameter in a custom (static) query and in an aggregateflex query in a simple dashboard. In the custom query, you can select either Industry or Country. The aggregateflex query shows ‘Sum of Amount’, grouped first by Industry and second by Opportunity Type and ordered by the Sum of Amount.
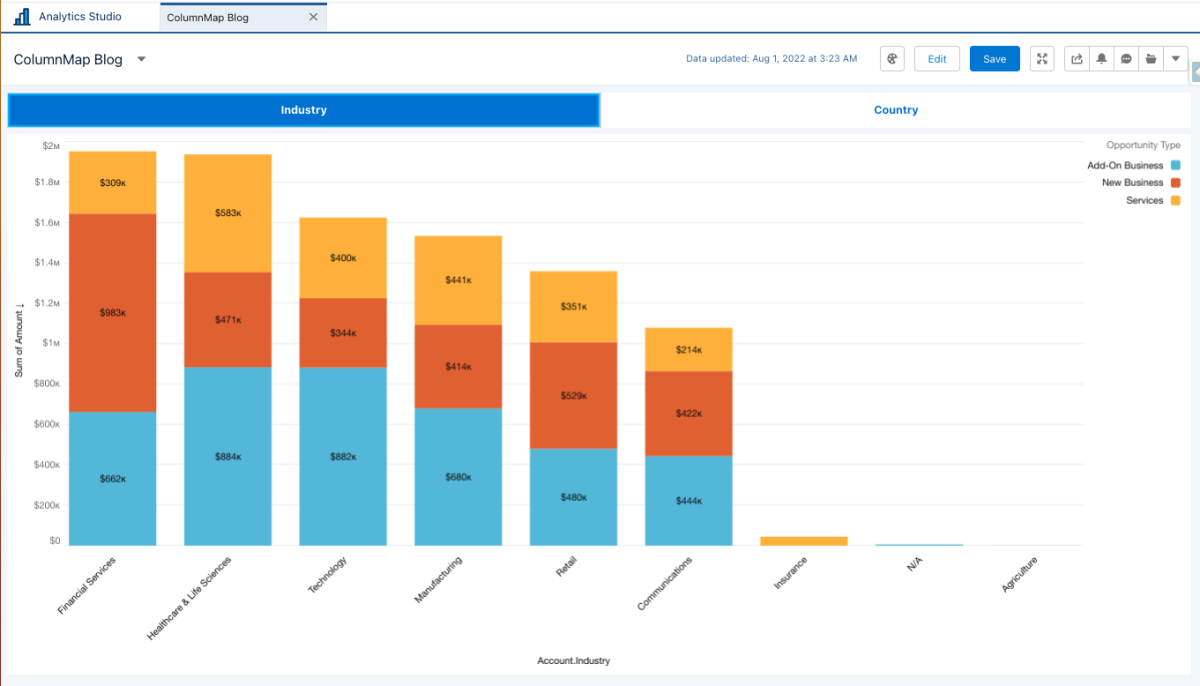
The way the two queries interact is that the user selects a value from the custom query, which sets the first grouping in the aggregateflex query and is used in the X axis.
On the right side of the page, click Advanced Editor, click the Query tab, and then locate the groups parameter in the JSON.
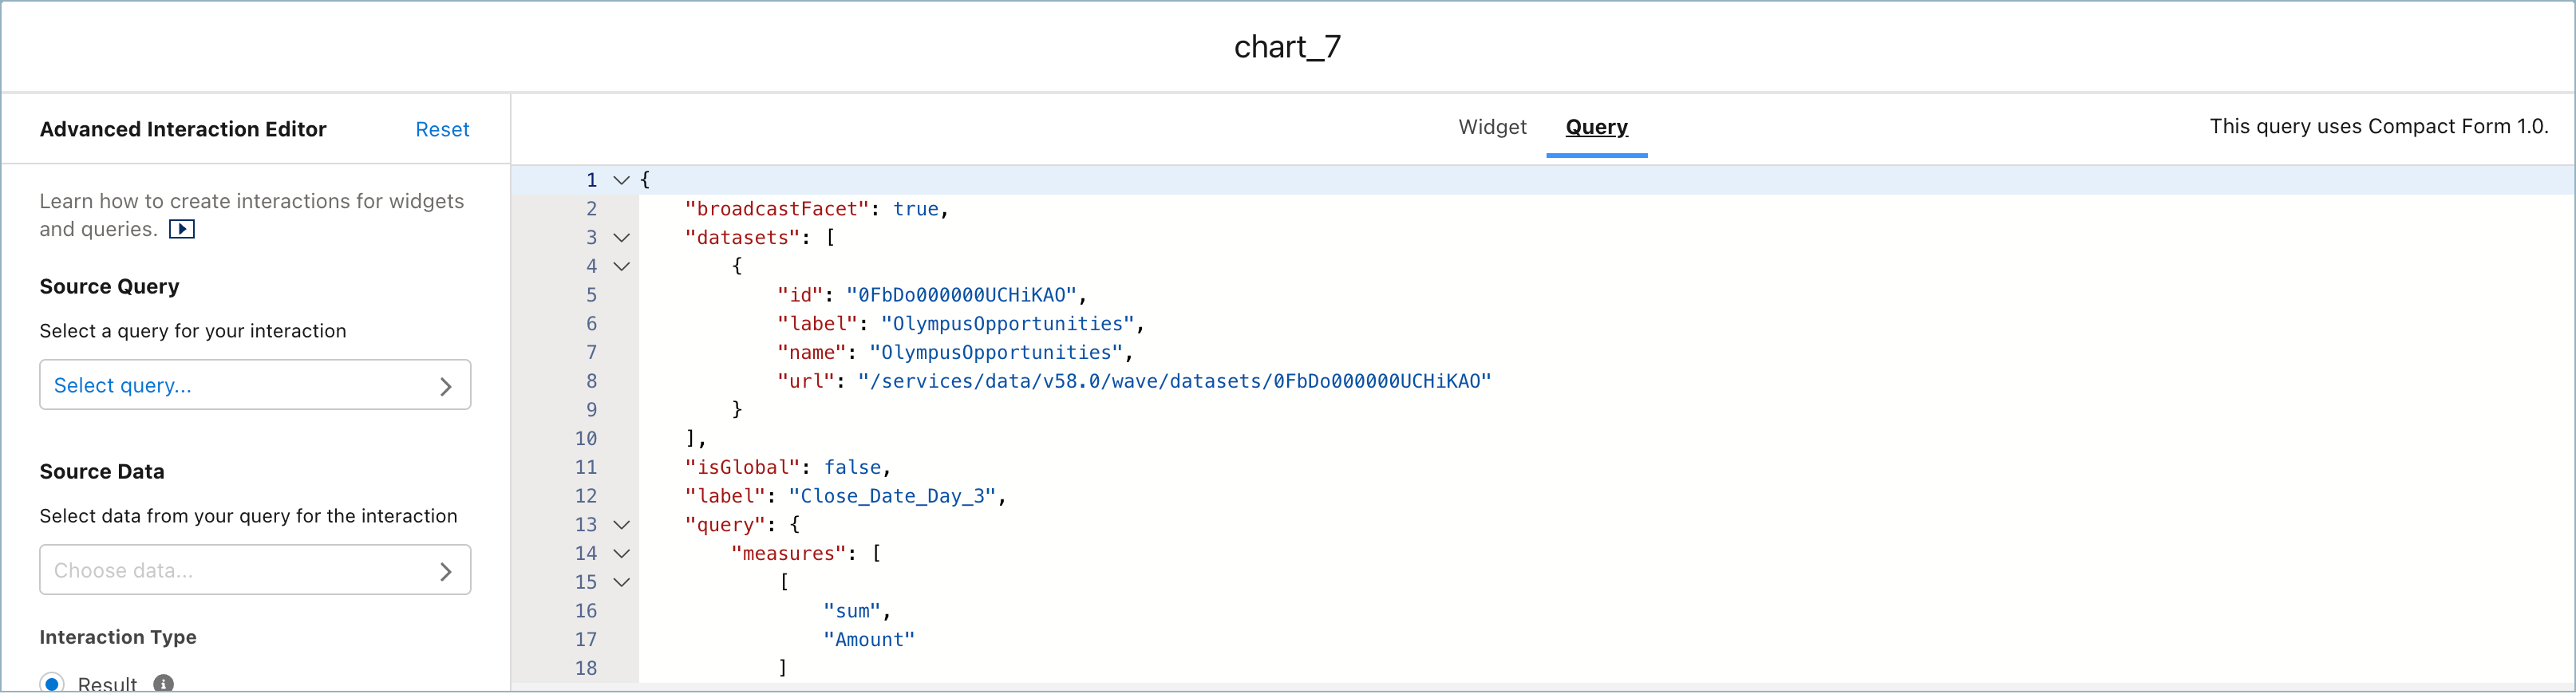
Replace Account.Industry with the interaction.
After you add your interaction to the groups parameter, locate the columnMap parameter in the JSON and add the interaction as the value of the dimensionAxis parameter.
Click the Widget tab and then repeat this process.
After you add your interactions, save your changes, refresh the page, and then click Preview to view your dashboard with the columnMap bindings.