Create Deeper Dependencies with Nested Interactions
With nested interactions, you can create deeper dependencies among widgets.
Example
For example, this pie chart shows the number of opportunities for each segment. It filters the results based on the selected grouping in the toggle widget and selected value from that grouping in the horizontal bar chart.
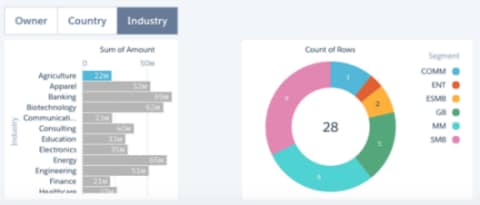
The pie chart can filter results based on the value of the selected grouping because it contains a nested interaction.
This example shows a nested interaction using column groupings. For an example of grouping with cells, see Data Selection Functions.
If you bind a measure or grouping in a query used for a chart, you must also replace the columnMap section in the widget-level chart JSON with an empty columns array. For more information, see Measure Interactions and Group Interactions.