In-App Developer Support
Mobile SDK 6.0 introduces several new screens in native apps for debugging during app development. These features usually do not require coding and are designed for debug builds.
The Dev Support dialog box is the launchpad for all available support screens. The dialog box presents only the options that are pertinent to the type of app you’re running. During debugging, you can access the Dev Support through a keyboard shortcut or gesture.
By default, these tools are enabled in debug builds only. However, if necessary, you can use an SDK call to enable or disable the tools in production builds.
iOS
To launch the Dev Support dialog box, use one of the following options.
- Shake your physical device.
- From the iOS Simulator menu, select Hardware | Shake Gesture.
- When your app is running in the iOS Simulator, use the
^+Command+zkeyboard shortcut.
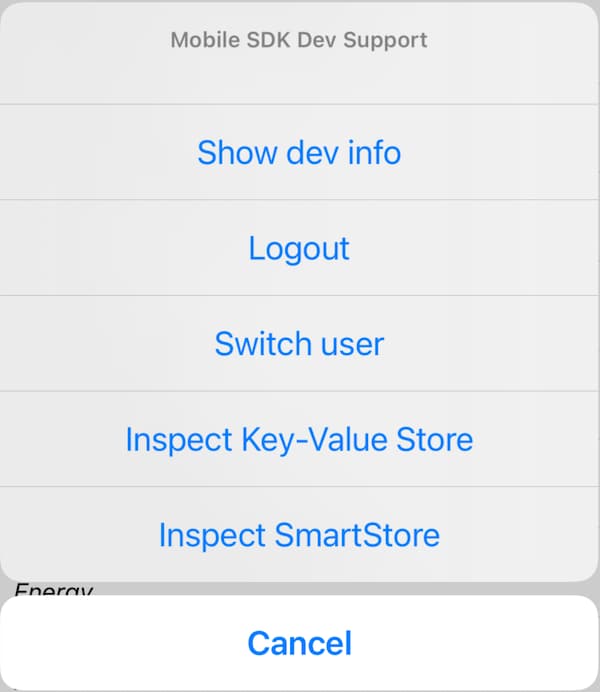
Here’s the iOS screen.
Android
To launch the Dev Support dialog box, use one of the following options.
- When your app is running in the Android emulator, use the
Command+m(Mac) orCtrl+m(Windows) keyboard shortcut. - In a system command shell, run:
adb shell input keyevent 82
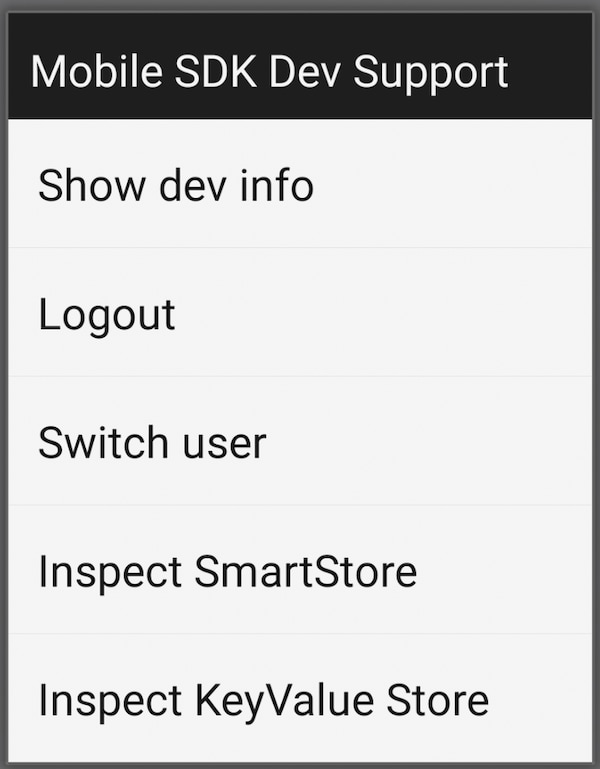
Here’s the Android screen.
If you require the Developer Support tools in production builds, set the property that indicates Dev Support is enabled. This use case is unusual.
iOS
Android
Don’t forget to disable the feature before distributing your app to the public.
The Dev Support dialog box presents options based on the app type. In every case you get:
- Show dev info—Brings up the dev info screen.
- Logout—Logs out the current user. Useful when you’re getting started and have not yet had time to add a logout button or action into your UI.
- Switch user—Switch to a different user. Useful when you are getting started and have not yet had time to add a switch user button or action into your UI.
- Inspect Key-Value Store—Lets you inspect values stored in the encrypted key-value store.
- Login Options—Provides tools to facilitate authentication testing without modifying the
bootconfigfile and recompiling the application. Clicking this button opens a menu with the following configuration and inspection sections:- Static Configuration: Shows the contents of
bootconfig.xml. On Android, contents are read-only. On iOS, you can modify values, which to achieve the same effect as modifyingbootconfig.xmlfor the session. - Dynamic Configuration: Open this section to test the runtime consumer key selection. Applications can now provide a block or lambda during login that returns an overriding consumer key, redirect URI, and scopes. Typing values into this screen creates a lambda/ block that returns those values. Click Use dynamic config to apply them. Unlike static configurations, previously typed dynamic configurations are cleared if the application is restarted.
- User Credentials: After logging in, open this section to view the actual settings captured by the Mobile SDK and saved with the user account. This includes the specific consumer key used for the login and the active access and refresh tokens. If your token format is JWT, an additional JWT Access Token Details section will appear to show the token’s expiration date and time.
- OAuth Configuration: Open this section to see the static configuration that was typed in or defined in your
bootconfigfile.
- Static Configuration: Shows the contents of
- If your application uses SmartStore, you also see:
Inspect SmartStore—Displays the SmartStore inspector screen.
SmartStore inspector is useful during development because it decrypts the data for display purposes. This decryption applies only to the inspector display—data remains encrypted on disk.
- If your application is a React Native application, you also see:
React native dev support—The React Native dev menu.
The Dev Info screen shows a collection of information about the app, its configuration, and so on, based on the app type. In every case you get:
- SDK version
- App type
- User agent
- Native browser for login enabled (indicates whether advanced authentication is configured)
- Identity Provider login enabled (indicates whether the app can use another app to provide login)
- Current user
- Authenticated users
- Boot config settings
- Managed (indicates whether the app is managed)
- Managed preferences (app settings pushed to the app by the MDM provider, if applicable)
For SmartStore apps, you get the following additional information:
- SQLCipher version
- SQLCipher compile options
- Names of user stores
- Names of global stores
The SmartStore Inspector screen is a legacy feature that lets user see a list of SmartStore soups and their indices, and run custom queries. In Mobile SDK 6.0, this screen adds a store picker that lets you choose which global or user store to inspect.
The Dev Info screen gets the information shown in its screen from a method named getDevSupportInfos in SalesforceSDKManager. Some subclasses of SalesforceSDKManager override this method. To show your own custom information, you can also override it. To do so, implement a subclass of SalesforceSDKManager, override the method, and use it in your application.
iOS
Android