Debug Jest Tests Using VS Code Advanced Configuration
VS Code lets you configure how you want to run your Jest tests in debug mode.
To use the advanced configuration:
-
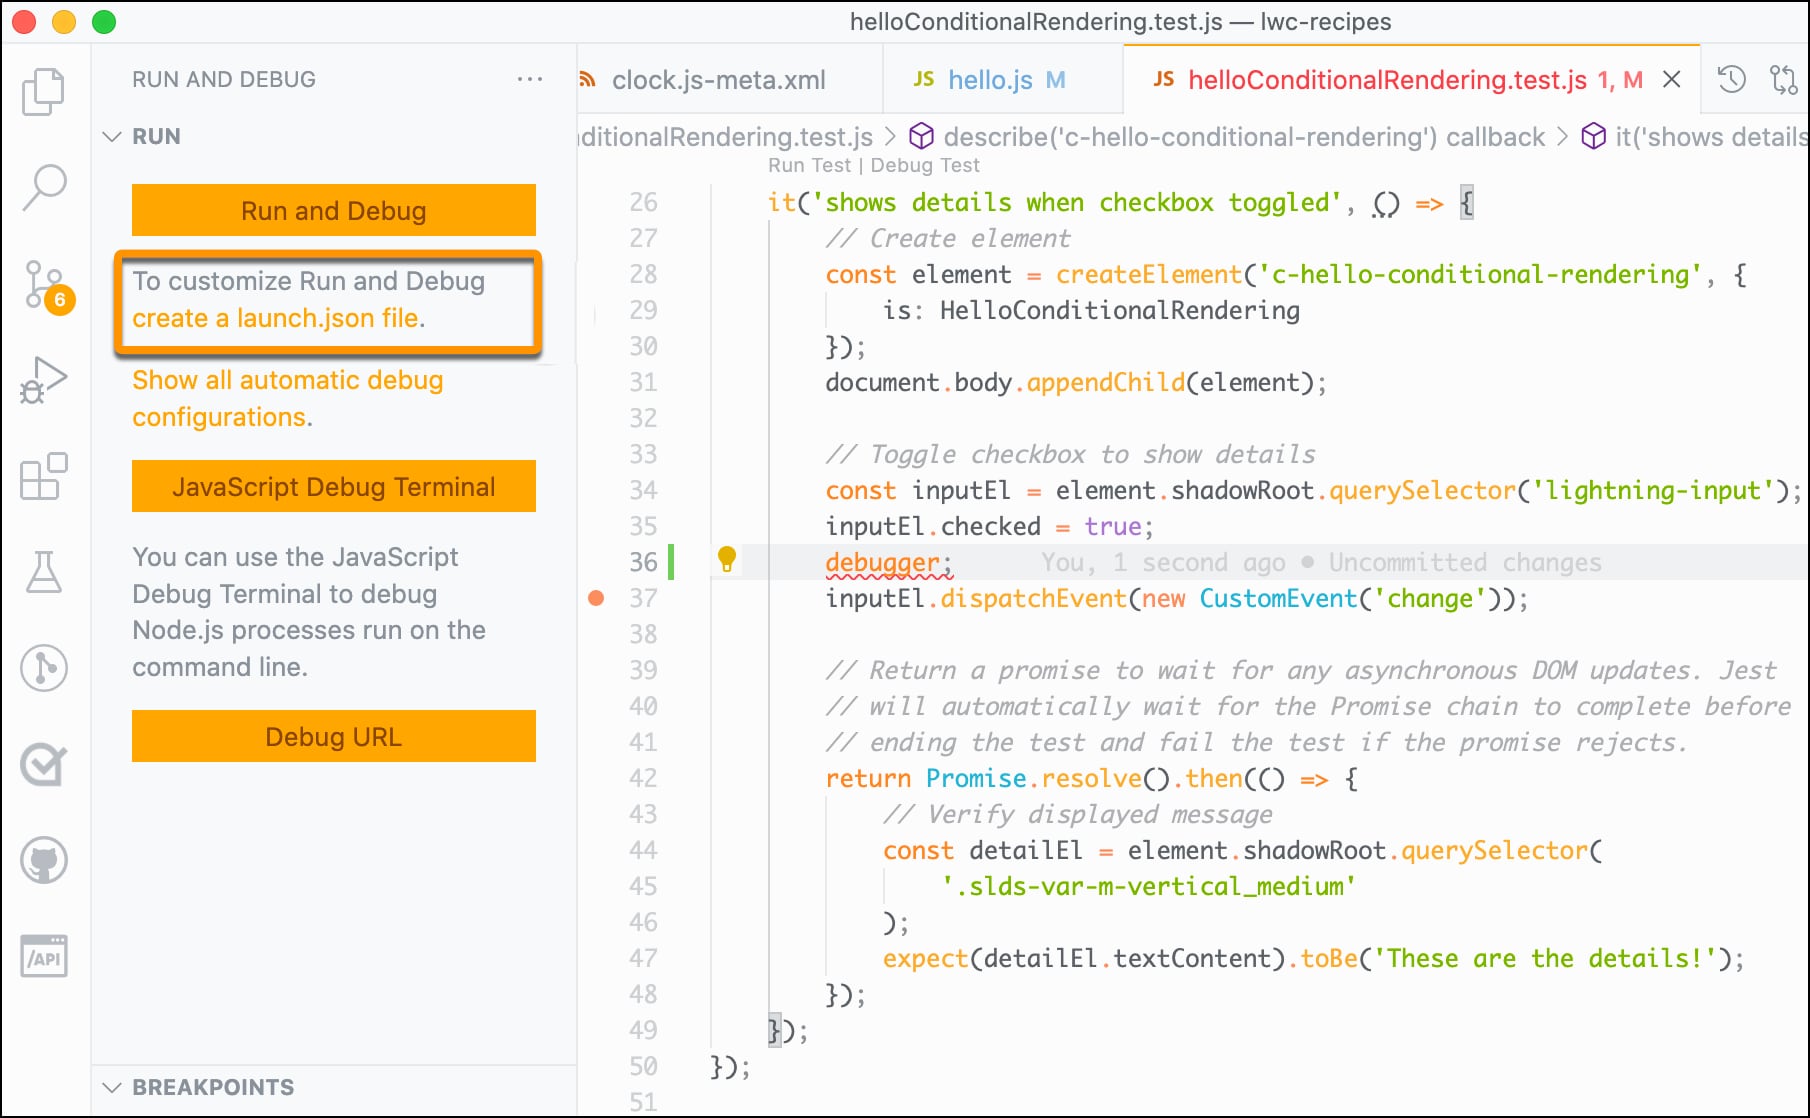
Generate the launch configuration file.
-
In the Run view, click the create a launch.json file link.

-
In the dropdown that appears, select Node.js, which creates a
launch.jsonfile for you. Replace the content oflaunch.jsonwith the configuration shown in Debugging in Visual Studio Code in the sfdx-lwc-jest repository.The configuration is different for Mac and Windows users. Follow the directions in the sfdx-lwc-jest repository to find the configuration for your operating system.
To customize your launch configuration for different debuggers and debugging scenarios, use VS Code's
launch.jsonattributes.
-
-
Add a Jest configuration file
jest.config.jsat the root of your Salesforce DX project. In this file, include the configuration code available at Overriding Jest Config in the sfdx-lwc-jest repository. The configuration code looks like this. -
Add
debuggerstatements in your test code and component's JavaScript file.When debugging using the advanced configuration in VS Code, adding breakpoints isn't supported. The line number to which you add a breakpoint doesn’t match the line number in the compiled file. Use the
debuggerstatement instead. -
Launch the configuration file. Go to the Run view. Select the Debug Jest Tests configuration and click Start Debugging (
 ).
).This command runs all the tests in your project by default, stopping in all the debugger statements you added in your test code and component's JavaScript file. You can view the execution output in the VS Code terminal, and use the debug features in VS Code, such as inspecting the variables using the Debug Console.
For information about troubleshooting Jest issues, see jestjs.io/docs/en/troubleshooting.