Debug Your Plugin
We recommend that you use Visual Studio Code’s (VS Code) built-in debugger to debug your plugin because the plugin generated from sf dev generate plugin already includes debugging configuration settings for VS Code.
VS Code has two core debugging modes: launch and attach. See Launch versus attach configurations for more info. We show how to use use both modes in this section.
Debugging a command involves passing different arguments or flags during a debug session. For this use case, we recommend you use the attach debug mode in VS Code for a better experience.
Let’s debug the hello world command that’s included in the plugin generated with sf dev generate plugin as the example in this topic.
We provide line numbers to help you find specific parts of the code. But the line numbers are for a file you just generated from running the sf dev generate plugin command. If you updated the hello world files since generating the plugin, then the line numbers will be different.
-
Set the
NODE_OPTIONSenvironment variable to--inspect-brk. To do this at the command line:For bash or zsh:
For PowerShell:
When using
attachmode, the Node.js process must be listening for a debugging client. Because oclif plugins usebin/dev.jsas the main executable, you must set theNODE_OPTIONSenvironment variable to pass options to it. -
In VS Code, open the top-level directory of your plugin.
-
Open
src/commands/hello/world.tsand set a breakpoint on the line with codeconst time = new Date().toDateString();(line 28, in therun()method) by clicking on the editor margin or usingF9on the line: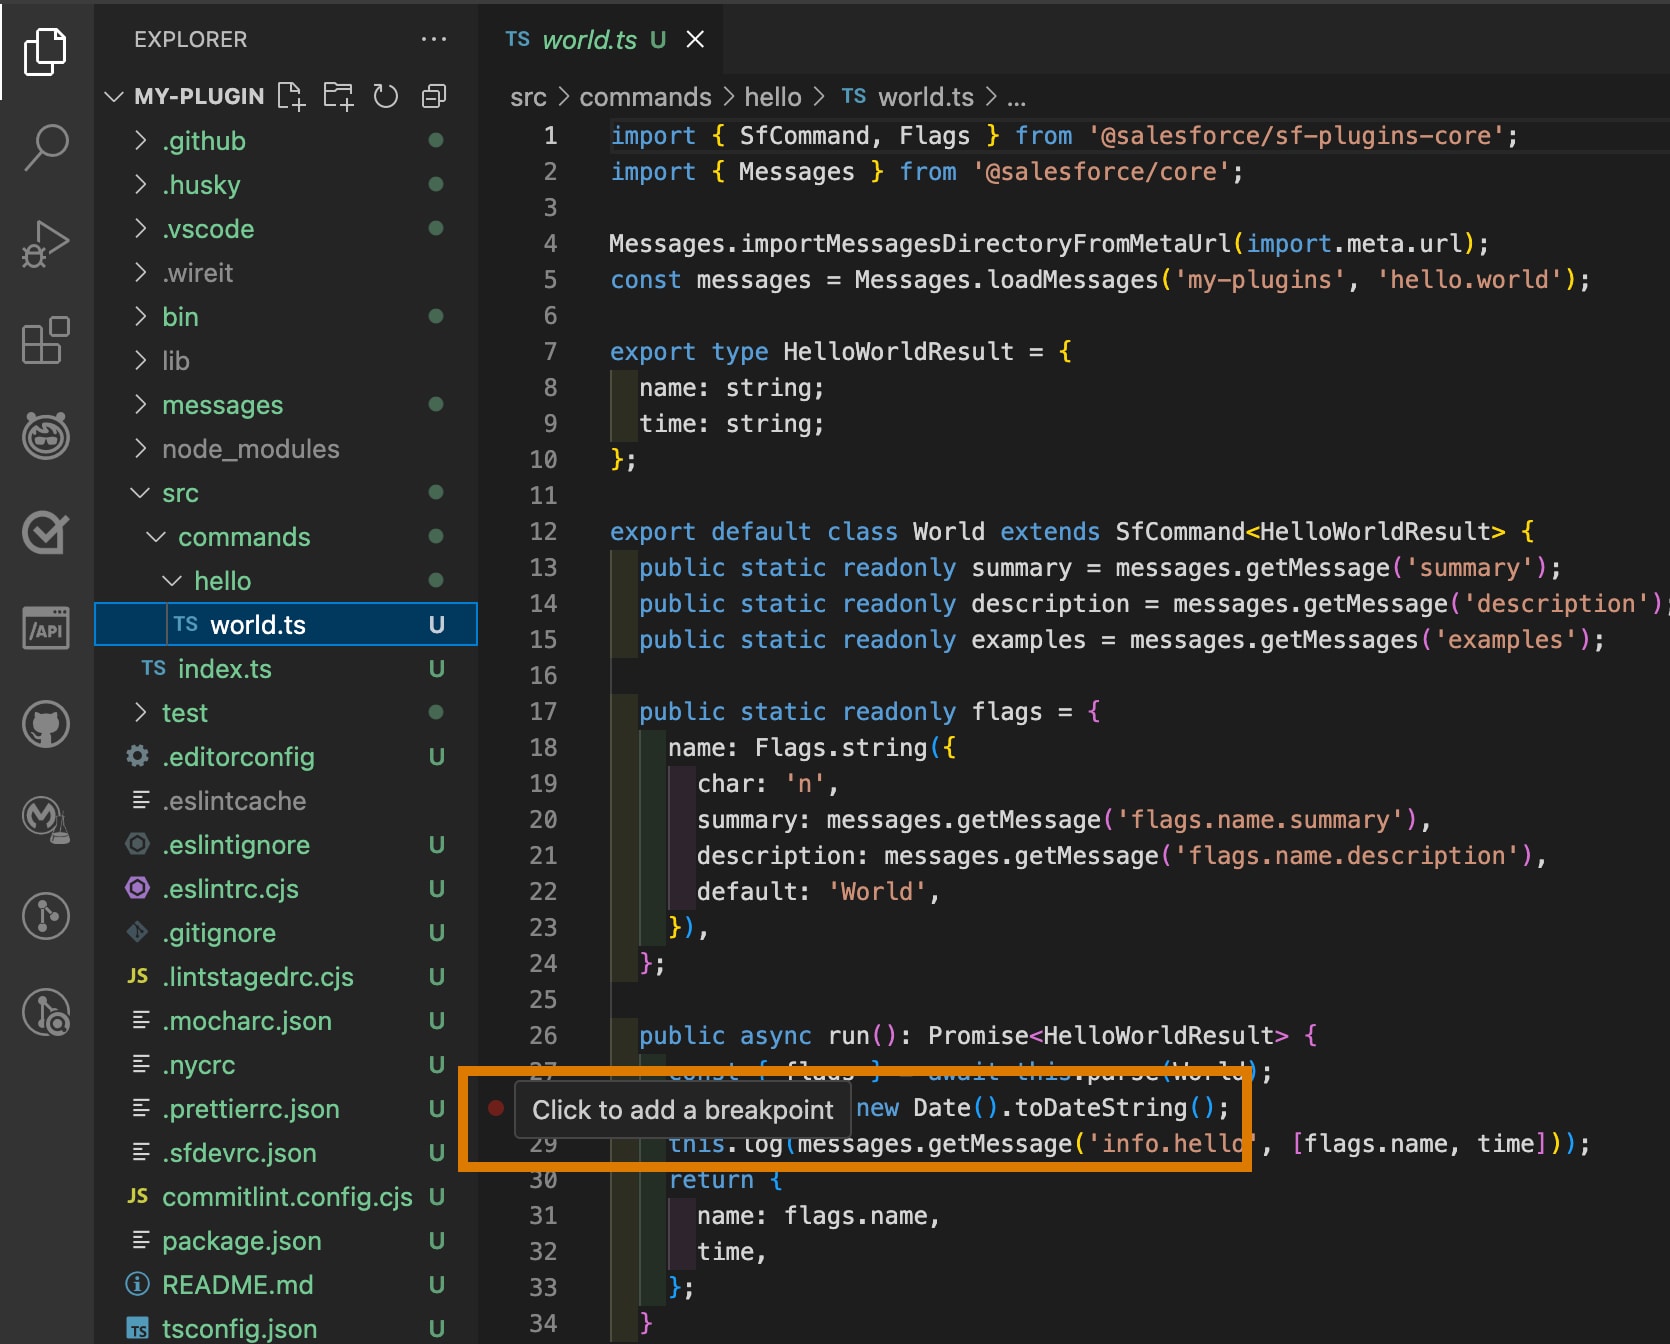
-
In VS Code’s integrated terminal, run the
hello worldcommand usingbin/dev.js.You should see output similar to this, indicating that the CLI process is waiting for a debugger to continue the execution:
-
Click the
Run and Debugicon in the Activity Bar on the left to attach the VS Code debugger to the CLI process you started in the previous step: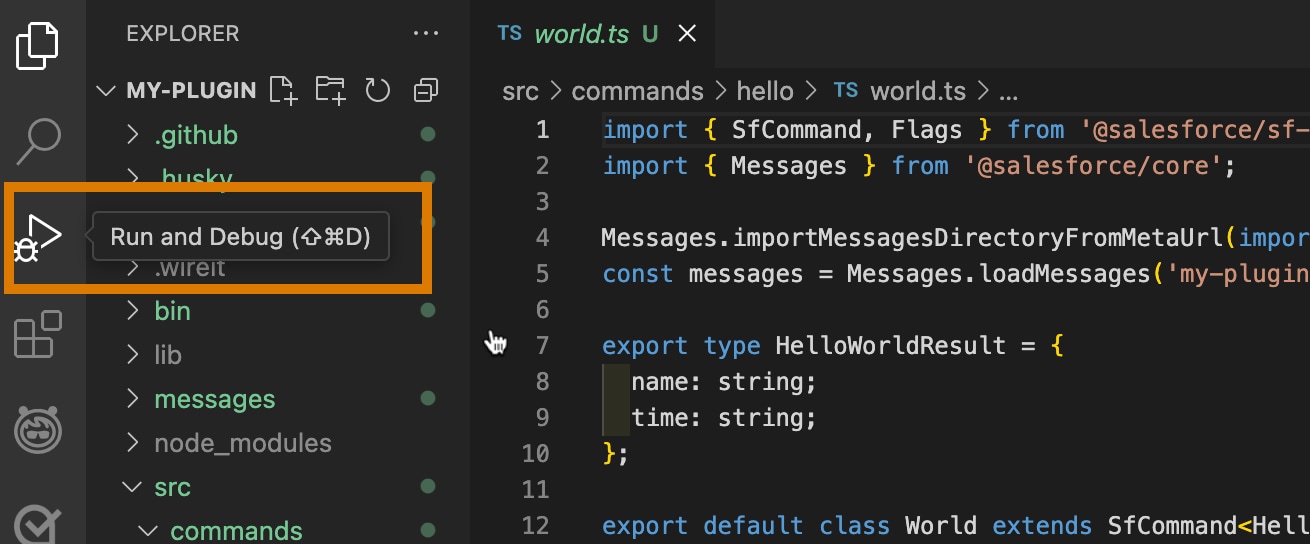
The Debug section opens, with information about variables, breakpoints, and more.
-
Select the configuration named
Attachusing the Configuration dropdown in theRun and Debugview. Then click the green arrow orF5to start a debug session.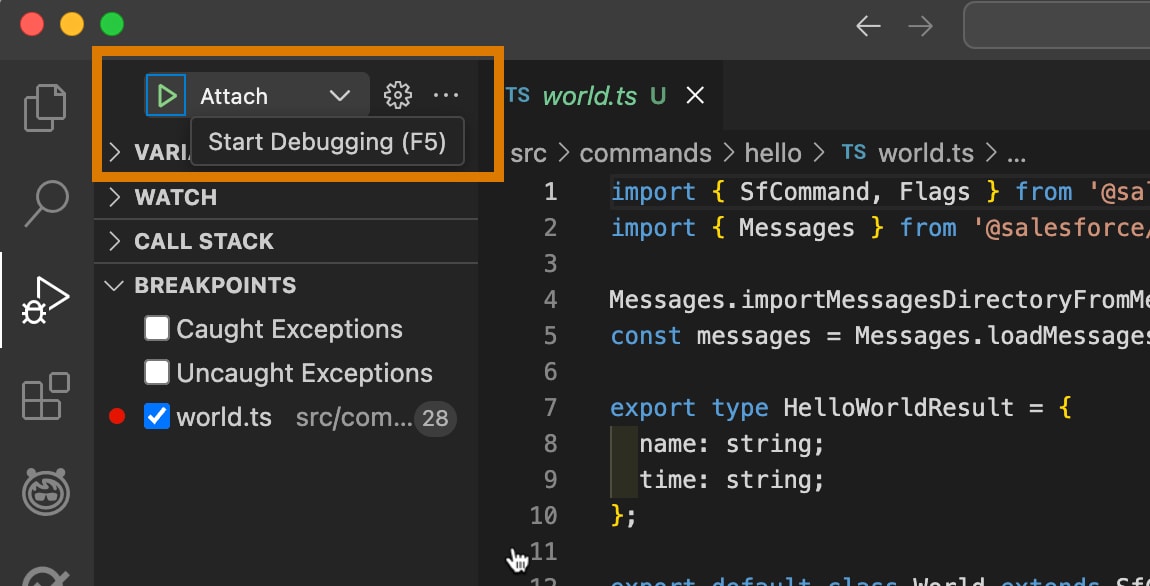
As soon as the debugger is attached, it jumps to line 8 of
bin/dev.jsbecause that’s where we started the CLI process. -
Click
Continuein the Debug Toolbar at the top, orF5, to continue the execution. The debugger stops at the breakpoint you set in Step 2:The
VARIABLESsection shows the values of local variables likeflagsandtime. Thetimevariable is still undefined, because the debugger stopped right at line 28, which is where the variable is defined and initialized.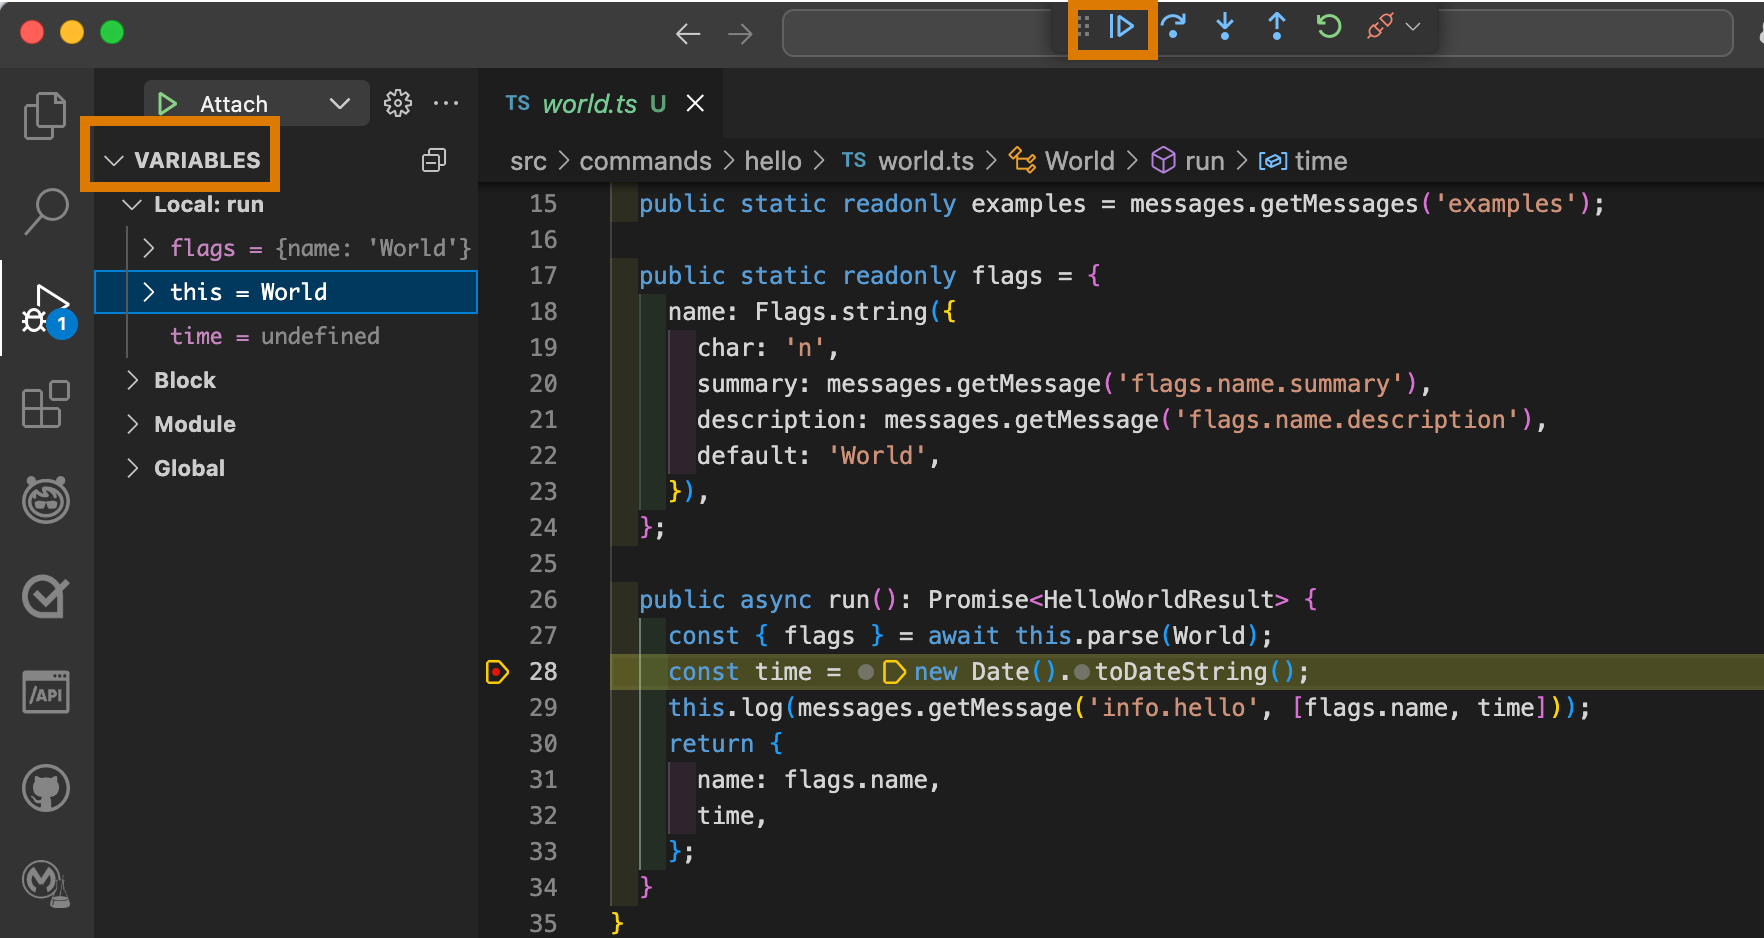
-
You can set breakpoints after the debug session started. Try setting one at line 29 (the line with code
this.log(messages.getMessage('info.hello', [flags.name, time]));), then clickContinueorF5. The debugger stops at this new breakpoint. And you now see that thetimevariable contains today’s date. -
To dig into a function or method call, click on the
Step Intooption in the Debug Toolbar (orF11) while on the line. The debugger jumps to the function or method definition. ClickStep Over(orF10) to continue debugging over the next lines.Click
Continue(orF5) to continue the execution, orDisconnectto detach VS Code from the process. -
When you finish the debug session, be sure to unset the
NODE_OPTIONSenvironment variable:For bash or zsh:
For PowerShell:
Unlike debugging a command, you don’t need to pass any options to a test because those are already in the code. This section shows how to use the launch debug mode in VS Code to debug the hello world command unit test.
-
Open
test/commands/hello/world.test.tsand set a breakpoint on the lineexpect(result.name).to.equal('World');(line 29):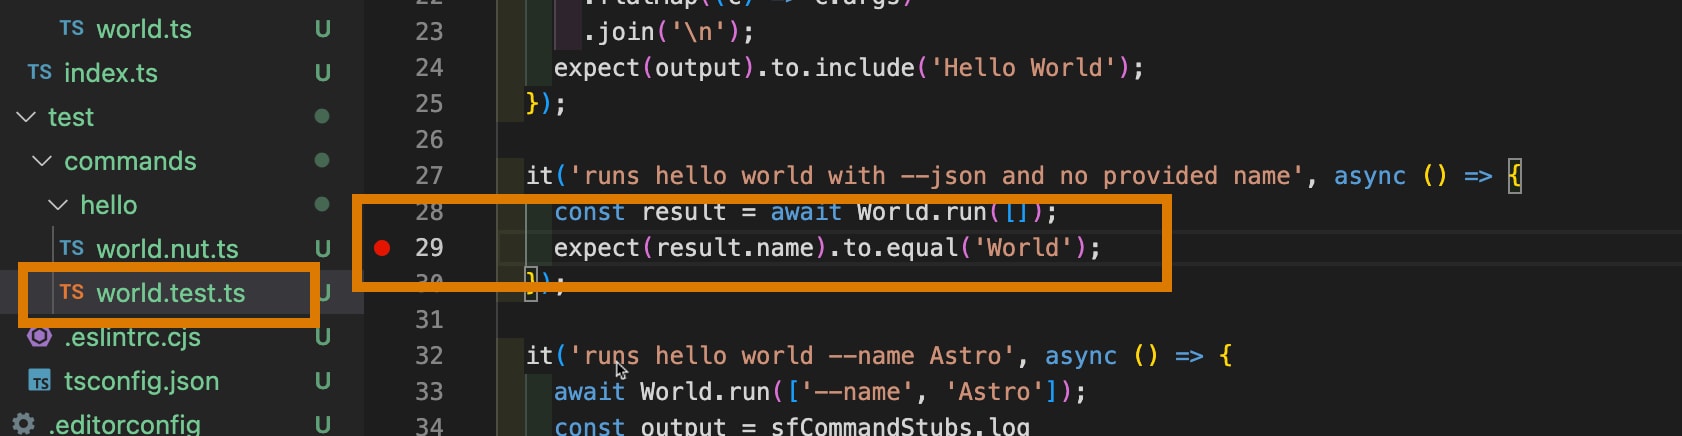
-
Select the
Run Current Testconfiguration from the Configuration dropdown in theRun and Debugview and press the green arrow, orF5, to start a debug session.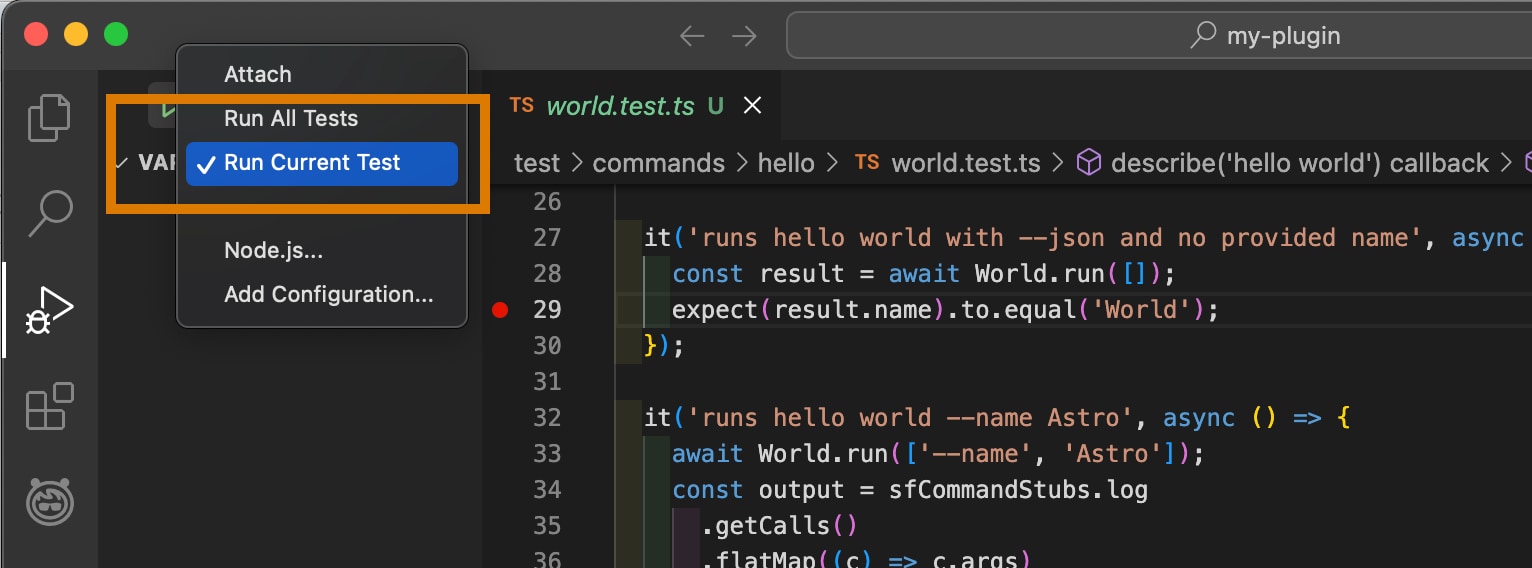
-
In this mode, VS Code starts the Node.js process to run the currently-open test file. The execution stops at the first breakpoint. Try hovering over the
resultobject on line 24 to see the JSON output the command in the test case returned: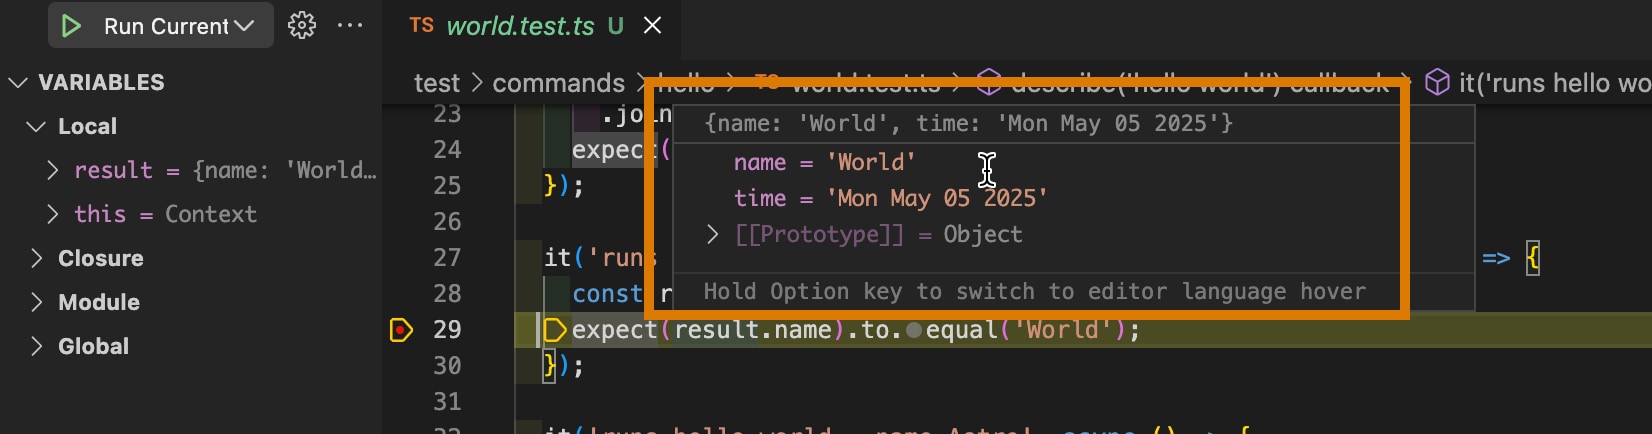
-
Click
Step Overin the Debug Toolbar on top (orF10) to continue debugging over the next lines.To continue with the execution, click
Continue(orF5). ClickStopto finish the Node.js process.