Use CLI Commands to Analyze Your Code
To get started using the Code Analyzer CLI commands, complete the prerequisites, install the Code Analyzer CLI plugin, and start analyzing your code by running the code-analyzer commands.
Code Analyzer extends Salesforce CLI with a plugin that contains these commands:
code-analyzer rules: List the rules that are available to analyze your code.code-analyzer run: Analyze your code with a selection of rules to ensure good coding practices.code-analyzer config: Display the Code Analyzer configuration state and optionally write it to a file.
- Code Analyzer is a Salesforce CLI plugin, so you must install Salesforce CLI on your computer. See Install Salesforce CLI for details.
- If you install Salesforce CLI using
npm, then be sure that you’re using Node.js v20 or later. The operating system-specific Salesforce CLI installers are pre-installed with the Active LTS status version of Node.js.
- If you install Salesforce CLI using
- The PMD, CPD, and Salesforce Graph engines depend on the Java Platform, Standard Edition Java Development Kit (JDK). Install JDK version 11 or later.
- The Flow Scanner engine requires Python. If you plan to use the Flow Scanner engine, install Python version 3.10.0 or later.
If you don’t plan to use engines like PMD, CPD, Salesforce Graph Engine, or Flow Scanner - perhaps because you don’t want to install their required dependencies like Java or Python - you can explicitly disable the engines so you don’t see errors when you run CLI commands. To disable the engines, update your code-analyzer.yml file, as they are typically enabled by default. For example:
The Code Analyzer CLI plugin is a JIT (just in time) plugin, which means that when you run one of its commands, such as code-analyzer rules, the plugin installs automatically into Salesforce CLI if it’s not already installed. If you prefer, however, you can install the plugin manually.
Open a terminal (macOS and Linux) or a command prompt (Windows) and then run this command.
To verify that you’ve installed it correctly, run this command:
The output shows all the core and user plugins currently installed in Salesforce CLI. If Code Analyzer is installed, you see an entry like this in the output; you might see a different version in your environment:
Run this command to list the Code Analyzer commands:
To view the full help about a specific command, including the long description and examples, use the --help flag.
You can also view the same information online in the Salesforce CLI Command Reference.
To view short help, use the -h flag:
To update Code Analyzer, rerun the installation command.
To uninstall Code Analyzer, run this command.
The remainder of this topic describes the out-of-the-box way to view the available rules and then run them against your code base. It assumes the default configuration. See Customize the Configuration for information on how to customize your configuration by creating a code-analyzer.yml file.
The best way to get started with the Code Analyzer CLI commands is to use the code-analyzer rules command see what rules are available. Play around with the filtering flags, such as --rule-selector and --workspace, to get the perfect list of rules you want to run. Then use these same flag values with the code-analyzer run command to run the same list of rules on your code base.
First run the code-analyzer rules command without any flags to get a concise list of the recommended rules for all available engines:
The command outputs something like this:
The table output includes these columns:
- The name of the rule. The name is unique within the scope of its engine, but not necessarily unique across all engines.
- The engine that the rule is associated with:
eslint,retire-js,regex,flow,pmd,cpd, orsfge. - The severity of the rule. Options are: 1 (Critical), 2 (High), 3 (Moderate), 4 (Low), or 5 (Info).
- The rule’s tags. In the preceding output, all the listed rules have the
Recommendedtag because that’s what the command returns by default.
Use the --rule-selector flag to be more selective about the list of displayed rules. For example, to display a table of all of the rules and not just the recommended ones, run this command and note that the list is longer:
To display details about all the eslint engine rules, run:
Run this command to view details about the recommended rules for only the eslint engine:
Use this command to generate config including suppressions
Use this command to generate config ignoring suppressions
You can use the --rule-selector flag to select specific rules. For example, this command lists the recommended eslint engine rules that also have the tag ErrorProne and a high severity level (2):
The default rule selector is Recommended, which selects the rules from all available engines that have Recommended as one of its tags. But if you provide your own rule selector with the --rule-selector flag, explicitly append :Recommended if you want to stay within the recommended rule set. For example --rule-selector eslint is equivalent to --rule-selector eslint:all, which selects all the available ESLint rules. But you typically want to use rule-selector eslint:Recommended to select just the recommended ESLint rules. The order and case of CLI flag values don’t matter, so --rule-selector recommended:eslint also works.
You can specify the --rule-selector flag multiple times to include other engines or other specific criteria; the rules are AND’d together. This example lists all the eslint engine rules that have a moderate (3) severity and the recommended retire-js engine rules with any severity:
You can also use parentheses when selecting rules to specify a group of comma-separated criteria. The commas act as logical ORs; combined with colons that act as logical ANDs, you can specify sophisticated rule selection criteria in just a single --rule-selector flag.
If you use parentheses with the --rule-selector flag, you must wrap the entire value in double quotes.
This example lists the rules associated with only the pmd engine that have the Security or Performance tags and a high severity (2).
You can use parentheses multiple times, such as in this example which runs rules associated with both the pmd and retire-js engines that have the Security or Performance tags and a high (2) or moderate (3) severity.
This command shows how to view the details of all the bundled rules for the regex engine, which is a new engine in v5:
Here’s how to view details about the bundled PMD rules:
The preceding examples list the rules based on the value you pass to --rule-selector. But you can also specify a workspace to get a more accurate list of rules that actually apply to your code base. A workspace is the set of files you want to include in your code analysis. A workspace is typically a single folder, although you can specify more files and folders, and even glob patterns (wildcards), if you want. When you specify a workspace, the rules command uses the file extensions in the workspace, such as .js (JavaScript) or .ts (TypeScript), to determine the rules to list. For example, if your workspace contains only JavaScript files, the command doesn’t list TypeScript rules. Let’s look at a few examples.
This command lists the recommended eslint rules that apply to the current folder (.):
This command lists all the recommended rules across all available engines that apply to all the files in the ./other-source folder and only the Apex class files in ./force-app:
Use the --target flag to target a subset of files in your workspace. This example list the recommended rules associated with a workspace (./force-app) but then uses a glob pattern to target a specific Apex class file in the workspace:
The previous section shows how to use the rules command to come up with the exact list of rules you want to run. So let’s run them! Use the run command to execute an analysis of your code using the same rules you listed with the rules command. Simply specify the same value for the --rule-selector flag.
First see what happens when you execute the code-analyzer run command without any flags.
You get this default behavior:
- Analyze the files in the current folder, which is the default workspace.
- Use the recommended rules across all available engines in the analysis.
- Display the output in the terminal with the concise table view.
- Automatically apply rule or engine overrides if a
code-analyzer.ymlorcode-analyzer.yamlfile exists in the current folder. See Customize the Configuration for more information about this file.
The default behavior is just like running this command, where the code-analyzer.yml file is either empty or contains only default values:
Use the --rule-selector flag to select the set of rules you want to run; this flag works the same as with the rules command. See List the Available Rules for lots of examples of using the --rule-selector flag, which you can also use with the run command. Here are a few more examples, such as this one that runs all the eslint engine rules and shows details about the violations:
Run all the PMD rules and display concise output::
Run all available rules:
Run all the eslint engine rules that have a moderate (3) severity and the recommended retire-js engine rules with any severity:
Run a single regex engine rule:
If you don’t specify a workspace, the run command analyzes the files in your current folder by default. But you can use the --workspace flag to specify the exact files or folders you want to analyze, and even use glob patterns (wildcards). If you specify the flag more than one time, then your workspace is the sum of the files and folders. In this example, the workspace consists of all files in the folder ./other-source and only the Apex class files (extension .cls) in the folder ./force-app.
Use the --target flag to analyze a subset of files in your workspace. This example runs the recommended rules stating with a single Apex class file (extension .cls) in the workspace (./force-app) by using a glob pattern:
The run command has a useful flag that the rules command doesn’t: --severity-threshold. Use it to specify a severity threshold so that the command fails with a non-zero exit code when a violation meets or exceeds the threshold. This example has a threshold of moderate (3):
Use this command to run analysis ignoring all suppressions
Finally, let’s see how to generate different output formats. By default, the analysis results are displayed to the terminal. Use the --output-file flag to also write the results to a file. The format of the file depends on the file extension that you provide, such as .csv for comma-separated values or .html for HTML. This example outputs to both a CSV and HTML file:
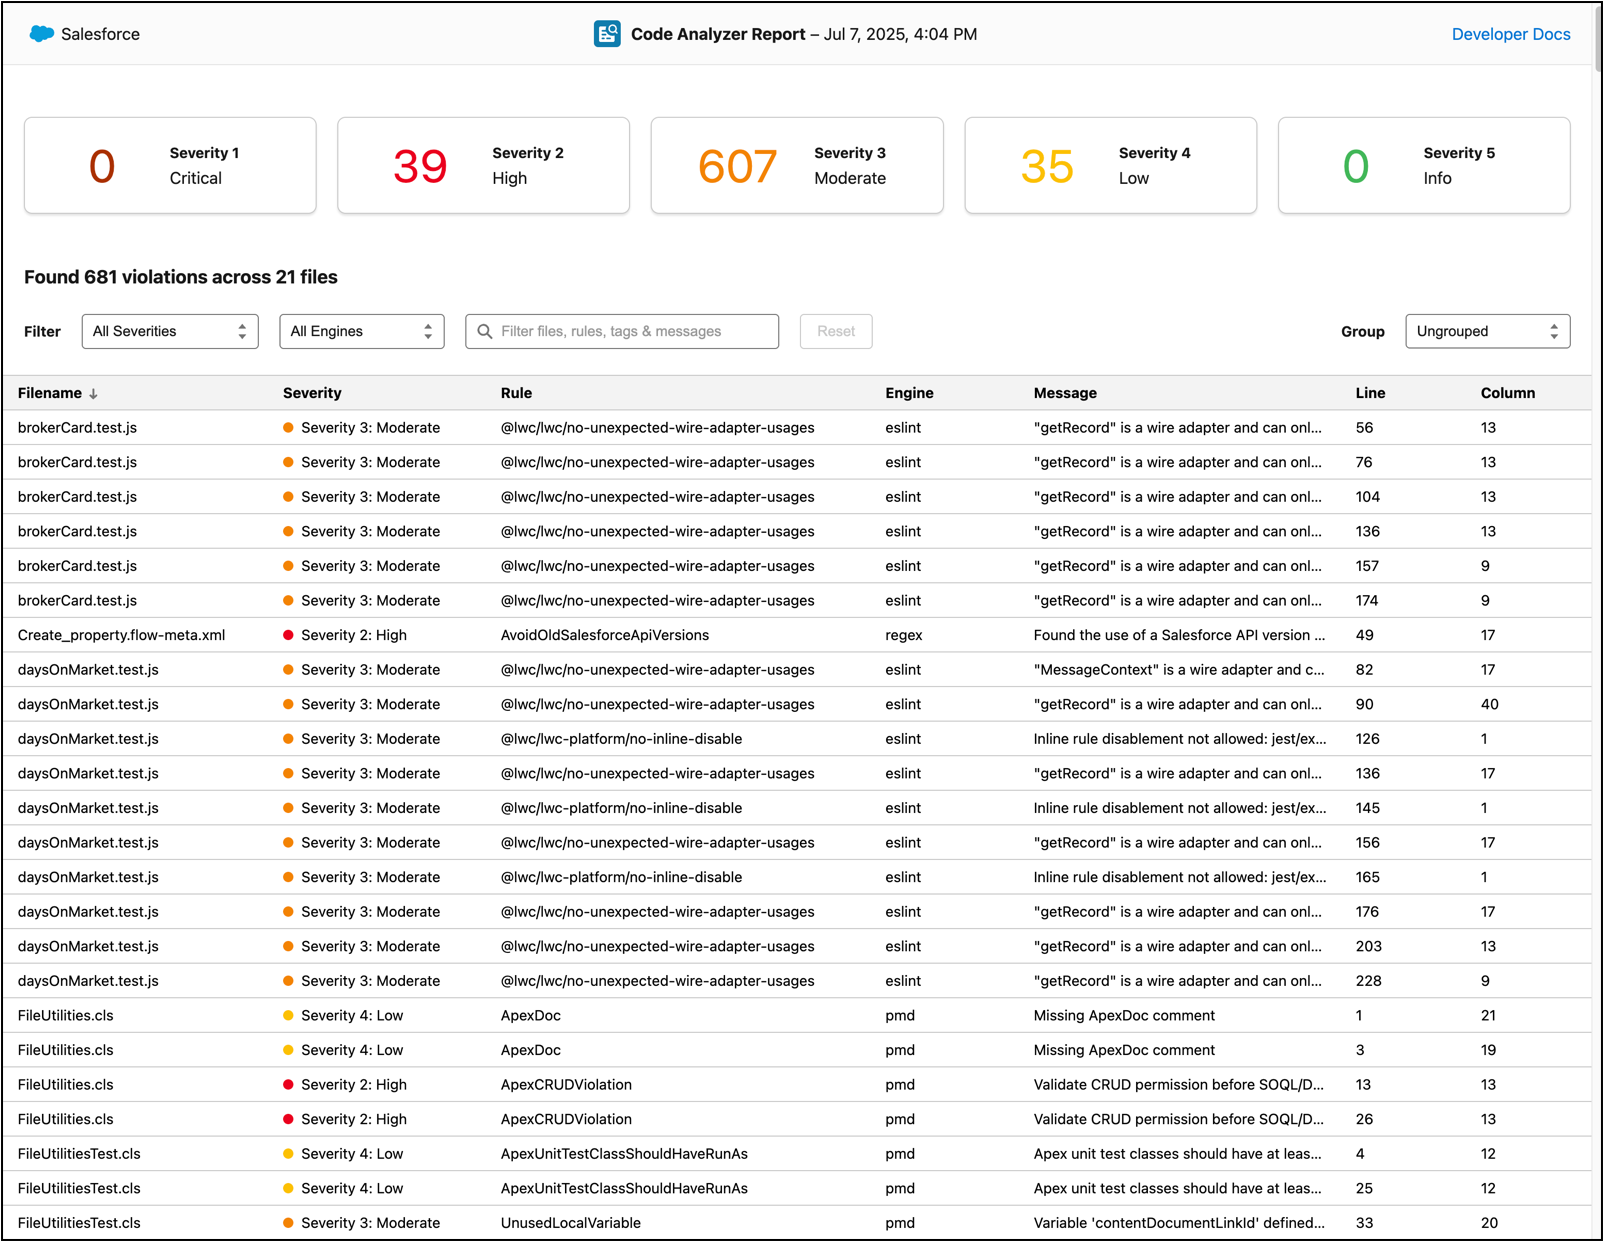
The HTML output provides a human-readable way to view and filter the violations; when you open the file in your browser you see something like this:
When sending output to the terminal in a human-readable format, the run command displays the same type of information for any violations it detects, regardless of the engine. For each violation, the command provides the following details:
- The name of the rule associated with the violation, such as
ApexCRUDViolation. - The severity of the violation. Options are: 1 (Critical), 2 (High), 3 (Moderate), 4 (Low), or 5 (Info).
- The engine that the violation is associated with:
eslint,retire-js,regex,flow,pmd,cpd, orsfge. - The violation message.
- The location(s) associated with the violation. If you use the default
--view tablethen only the primary location is shown. When using--view detailthen all locations are shown. For some violations, such as those associated withPathBasedrules, the locations make up the path that is associated with the violation. - Helpful resources, such as the URL to additional information about the violation.
Let’s take a closer look at partial output of this command, which runs all rules tagged Security on the code in the current folder.
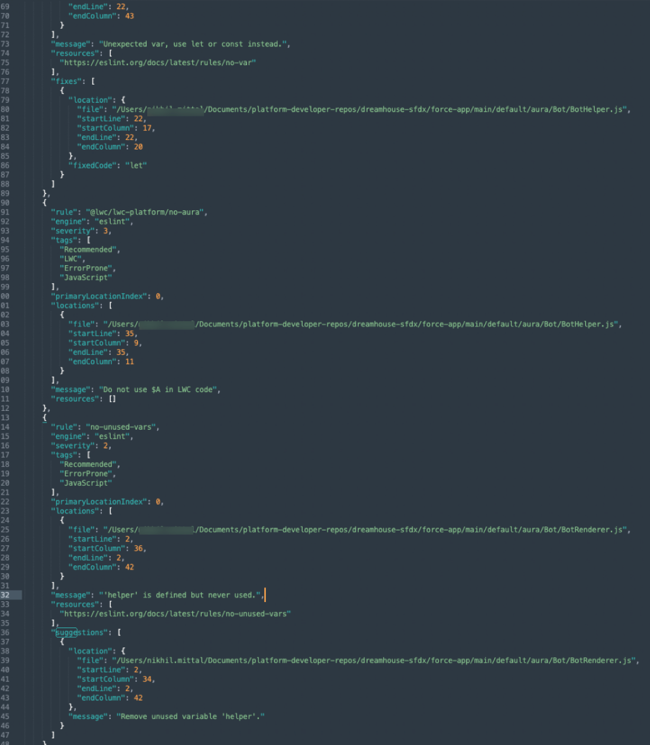
The output looks something like this:
Here are a few notes about the sample output which can help you analyze your own results:
- The
engineproperties in the output show that the analysis included violations of the PMD, ESLint, Flow Scanner, and Regex rules. - The severities of the violations ranged from 4 (Low) to 2 (High).
- The
ApexCRUDViolationPMD violation occurred in the fileforce-app/main/default/classes/ExperienceBookingHelper.clsbetween lines 27 and 37. - The
PreventPassingUserDataIntoElementWithSharingFlow Scanner violation shows two locations: the one marked(main)is the primary location where the violation occurred and the other is the start of the path analysis.
If you want concise table-formatted output, specify --view table (the default view). Table format doesn’t show as much information as the detailed view.
If you use the --output-file to write the results to a file, you get similar information but in a different format, such as HTML, comma-separated values (CSV), JSON, XML, or SARIF. For details, see Output Schemas Reference.
Use --include-fixes and --include-suggestions Code Analyzer CLI flags to include actionable guidance in your scan results. Enable these flags and generate an output file that contains available fixes and suggestions for detected violations. Details, such as the file path, line number, and column number, help you locate and resolve issues. Fixes and suggestions aren’t available for every violation.
Output Formats
You can generate fixes and suggestions for violations in these formats.
- JSON
- XML
- SARIF