Query Event Log Files
Learning Objectives
After completing this unit, you’ll be able to:
- Query an EventLogFile object using Developer Console.
- View events in Salesforce Event Log File (ELF) Browser.
- Learn about EventLogFile event types.

In this module, we assume you are a Salesforce admin with the proper permissions to enable event monitoring. If you’re not an admin for Salesforce, that’s OK. Read along to learn how your admin would take the steps in a production org. You can also follow along using a Trailhead Playground, but it takes 24 hours for events to appear in log files.
View Events in Salesforce Event Log File Browser
The Salesforce Event Log File (ELF) Browser allows quick access to event log files. With the ELF Browser, you can easily find and download events from various time periods without a line of code. 
To access the Event Log File Browser:
- Go to Setup.
- In the Quick Find box, enter
Event Log File Browser.
- Select Event Log File Browser.
Query Event Log Files in Developer Console
Let’s consider an example: A sales rep named Rob Burgle left your company a few weeks ago and joined a major competitor. All of a sudden, you start losing deals to this other company. You suspect that Rob downloaded a report containing confidential lead information and shared it with his new employer. Normally, you wouldn’t be able to confirm your suspicions. But with Event Monitoring, you can gather all the evidence you need to set the story straight. Let’s look at how this process works.
It takes only a couple of clicks to open the Developer Console from Lightning Experience. The Developer Console is an integrated development environment with a collection of tools you can use to create, debug, and test applications in your Salesforce org.
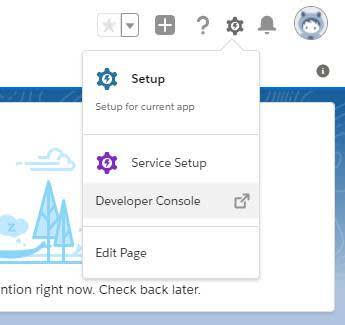
To open the Developer Console from Lightning Experience:
- Click
 .
.
- Click Developer Console.
Now we’re ready to open the EventLogFile to query the information.
- Click File | Open.
- Under Entity Types, select Objects.
- In the Filter the repository field, type
EventLogFile.
- Select EventLogFile under Entities.
- Click Open.
- Select the fields for your query and click the Query button.

- Click the Execute button to complete the query.

You can use the Query Editor in the Developer Console to execute a Salesforce Object Query Language (SOQL) query. The History pane displays your last 10 queries for quick reuse. Results are displayed in a Query Results grid.
The Query Results grid displays each record as a row. You can open, create, update, and delete records without leaving the Developer Console.
Event Log File Documentation for Event Types
The EventType field in the EventLogFile object supports events. Every event type is documented in the Salesforce Object Reference. In it, you can see the fields and their descriptions, and sample queries to use.
For example, for the DB_TOTAL_TIME field, the event type Number is the time in nanoseconds for a database round trip, which includes time spent in the JDBC driver, network to the database, and DB_CPU_TIME. As an admin, you can compare this field to CPU_TIME to determine whether performance issues are occurring in the database layer or in your own code.

Report events contain information about what happened when a user ran a report—things like the date and time, the report name, the records referenced in the report, the number of rows and columns, and the originating user, among many others.
You can also use the REST API to interact with Event Monitoring logs; Event Monitoring is accessed through the Lightning Platform SOAP API and REST API by way of the EventLogFile object. So, you’re able to integrate log data with your own back-end storage and SEIM to correlate data from multiple orgs and across disparate systems.
In the next unit, let’s explore how to download and visualize event log files to get one step closer to providing insight into malicious user behavior using Event Monitoring.
Resources
-
Salesforce Developer Documentation: EventLogFile
-
Salesforce Developer Documentation: EventLogFile Supported Event Types
-
Salesforce Help: Developer Console
-
Salesforce Help: Query Results Grid
-
Saleforce Help: Event Log File Browser
-
Salesforce Developer Documentation: Command-Line Interface (CLI)
-
Salesforce Developer Documentation: VS Code Extension