The new user interface in Spring ’14 for monitoring Metadata API-based deployments in Salesforce allows you to do a lot more than ever before. Previously, you couldn’t inspect the errors of in-progress deployments in real time. Completed deployments that failed were shown but without any detailed error messages. Now, with the redesigned deployments page, you can get access to all this and more! You can drill down through the list of component errors and test failures whether your deployment is still running or has finished, identify long-running tests, find out which test is currently running, and so on. Note that this page shows deployments started via the deploy() metadata API, which includes Force.com IDE, Force.com Migration Tool, but not change sets.
In this blog, I’m going to show you what you can do with the Deployment Status page by going through some scenarios.
Checking the Status of an In-Progress Deployment
First off, I started a deployment with 450 components. The Deployment Status page shows this deployment as in progress and I see that my deployment already has 2 errors and hasn’t completed yet.

Hmm… I wonder what’s going on. Let me check by clicking View Errors for the in-progress deployment. I am presented with a list of all errors encountered so far while the deployment is still running. In my case, I get the following two errors as you can see below.
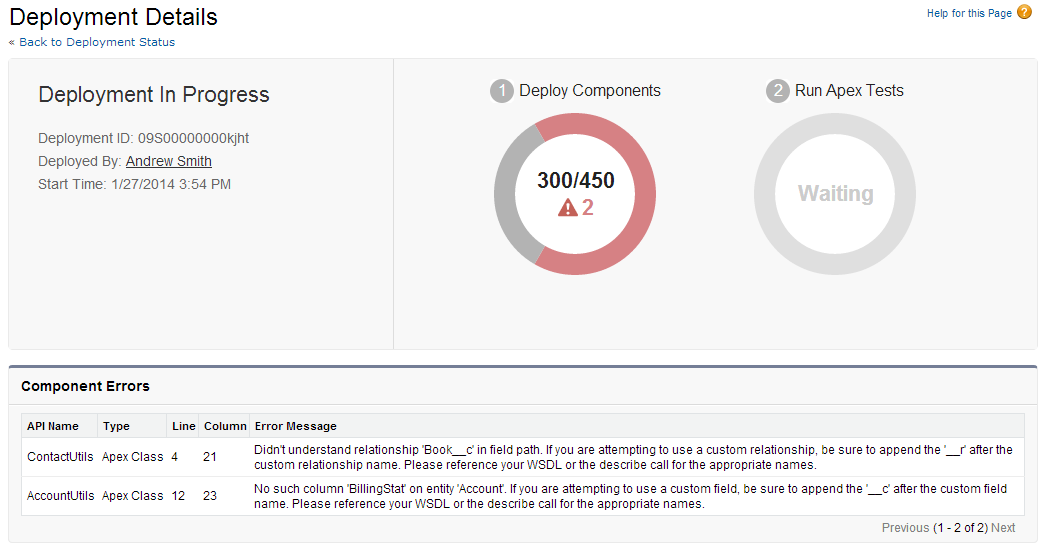
The first error is about a relationship name used in a method in an Apex class. This looks like it’s a typo and I can modify the Apex method to use the right relationship name for the custom object, in my case Book__r.
The second error is also in a method in another Apex class. Obviously, the field name has been misspelled. The field name should be BillingState.
Now, I can start fixing those errors without waiting for the deployment to finish. If more errors are encountered while the deployment is running, I can click View Errors again in the Deployment In Progress section to see any new component errors. After the deployment finishes, the Deployment Details page will show the list of all errors encountered for the deployment.
Because two-thirds of the components have already been processed in my deployment, it’s likely that there aren’t any other errors. I take a chance and decide to cancel this deployment. After fixing the two errors, I click Cancel in the Deployment In Progress section. Now, I’m going to restart the deployment and hope for green donuts (no errors) and a successful deployment!
Will my Components Require Apex Tests?
Let’s say I want to know if my components will require tests when deployed to production. To find out, I’m going to start a validation-only deployment to production, which won’t commit any components. I am deploying a custom application component, two reports, and a dashboard. The Apex tests donut chart shows “Not Required”. So this tells me that I don’t need to write any Apex tests for deploying my components to production.

Finding the Slow Culprits
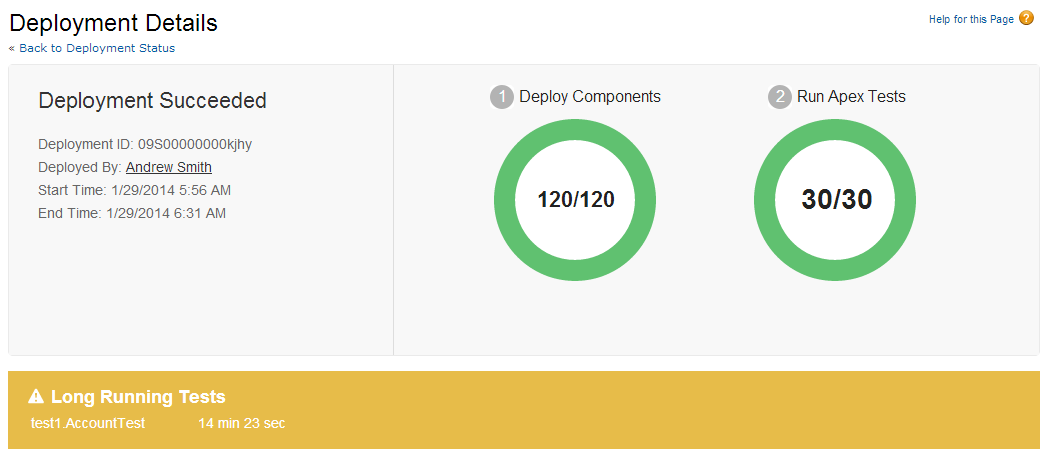
Have you encountered a situation when test runs are taking a long time and you don’t know the culprit? Worry no more. The Details page of a deployment flags slow Apex tests that are delaying your deployment. The Details page shows the top five tests that ran for more than two minutes. This can happen if you have an Apex test that’s not following performance best practices and is working on a large data set. Knowing which test to modify is now easier. In the below image, you can see that my completed deployment has one slow test that ran for over 14 minutes.
Now that I know which test is slow, I can investigate what I can do to improve its performance. There are several causes for slow performance. For example, accessing organization data instead of using test data can be one reason. Also, having a test that exercises SOQL queries or Apex code with bad performance in triggers and classes is another cause for long execution times. Check out the Related Resources section for resources about Apex and SOQL performance best practices.
Viewing Apex Test Results
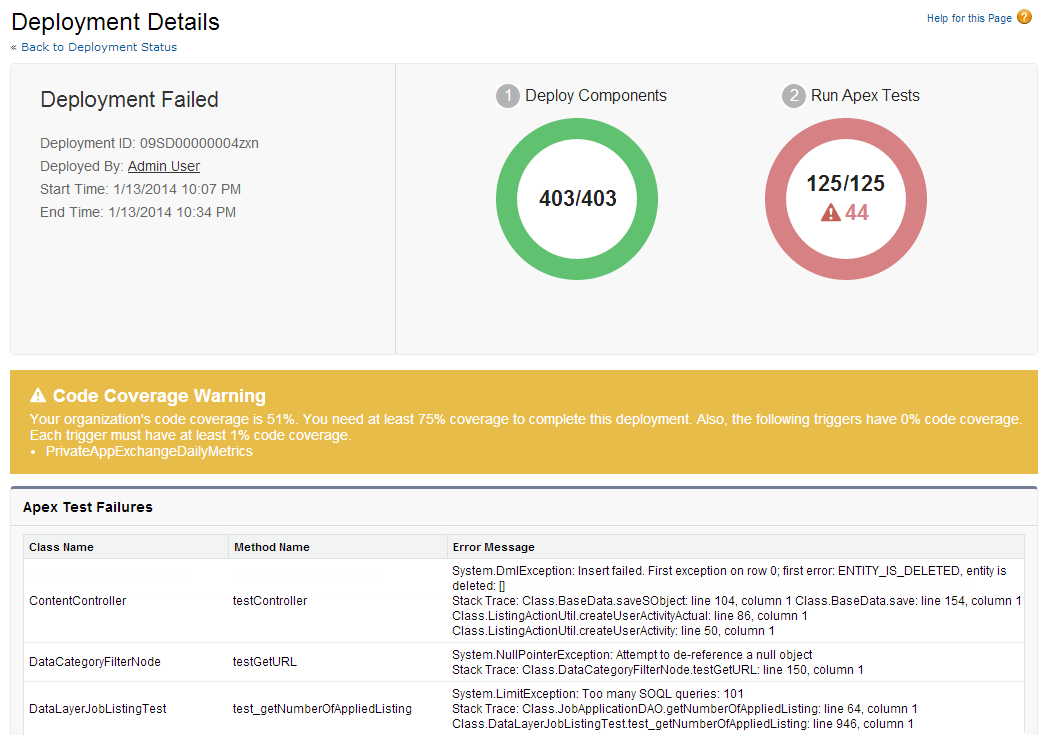
When all components have been deployed successfully, Apex tests are run. The below deployment has many test failures. I can view the error message for each test failure in the Details page. Also, the Details page has a code coverage warning informing me that my tests didn’t reach the required 75% code coverage for deployment. I have 51% code coverage and one Apex trigger has no coverage at all (0%). This means that I need to go back and write some more tests before attempting to redeploy!
Summary
I hope this blog post enabled you to see the many benefits of the Deployment Status page and that you’ll start using it!
Related Resources
Metadata API
Performance Tuning
- Isolation of Test Data from Organization Data in Unit Tests
- Working with Very Large SOQL Queries
- Apex Code Best Practices
- Webinar: Inside the Force.com Query Optimizer
- Query and Search Optimization Cheat Sheet
- Force.com Performance Profiling Using the Developer Console
- Performance Tuning for Visualforce and Apex Webinar
- Architect Core Resources
Acknowledgments
Thanks to my colleagues Ganesh Mathrubootham and Kunal Vyas for their help with this blog post.