You built an Agentforce agent with Agent Script. You test it—and something’s off. Maybe the agent routes to the wrong topic, skips an action you expected to run, or replies in a way that doesn’t match your instructions.
The good news: each conversation turn produces a trace you can use to debug with evidence. You can see which topic was selected, which actions were available or invoked, what variables changed, and where the reasoning loop spent its time.
In this post, we’ll start by understanding Agent Script execution flow. Then we’ll walk through how to use Agentforce Builder and Agentforce DX to debug Agent Script. After that, you’ll learn a Vibe debugging workflow using Agentforce Vibes, where you paste the JSON execution trace, describe what you expected versus what happened, and use the suggestions to refine your Agent Script.
Understand Agent Script Execution Flow
To effectively debug agents built with Agent Script, you need to first understand how execution actually flows. The diagram below helps you to understand the execution flow. Think of it less like debugging a linear script and more like tracing a loop with two fundamentally different execution modes happening inside it: deterministic instruction execution and non-deterministic reasoning.
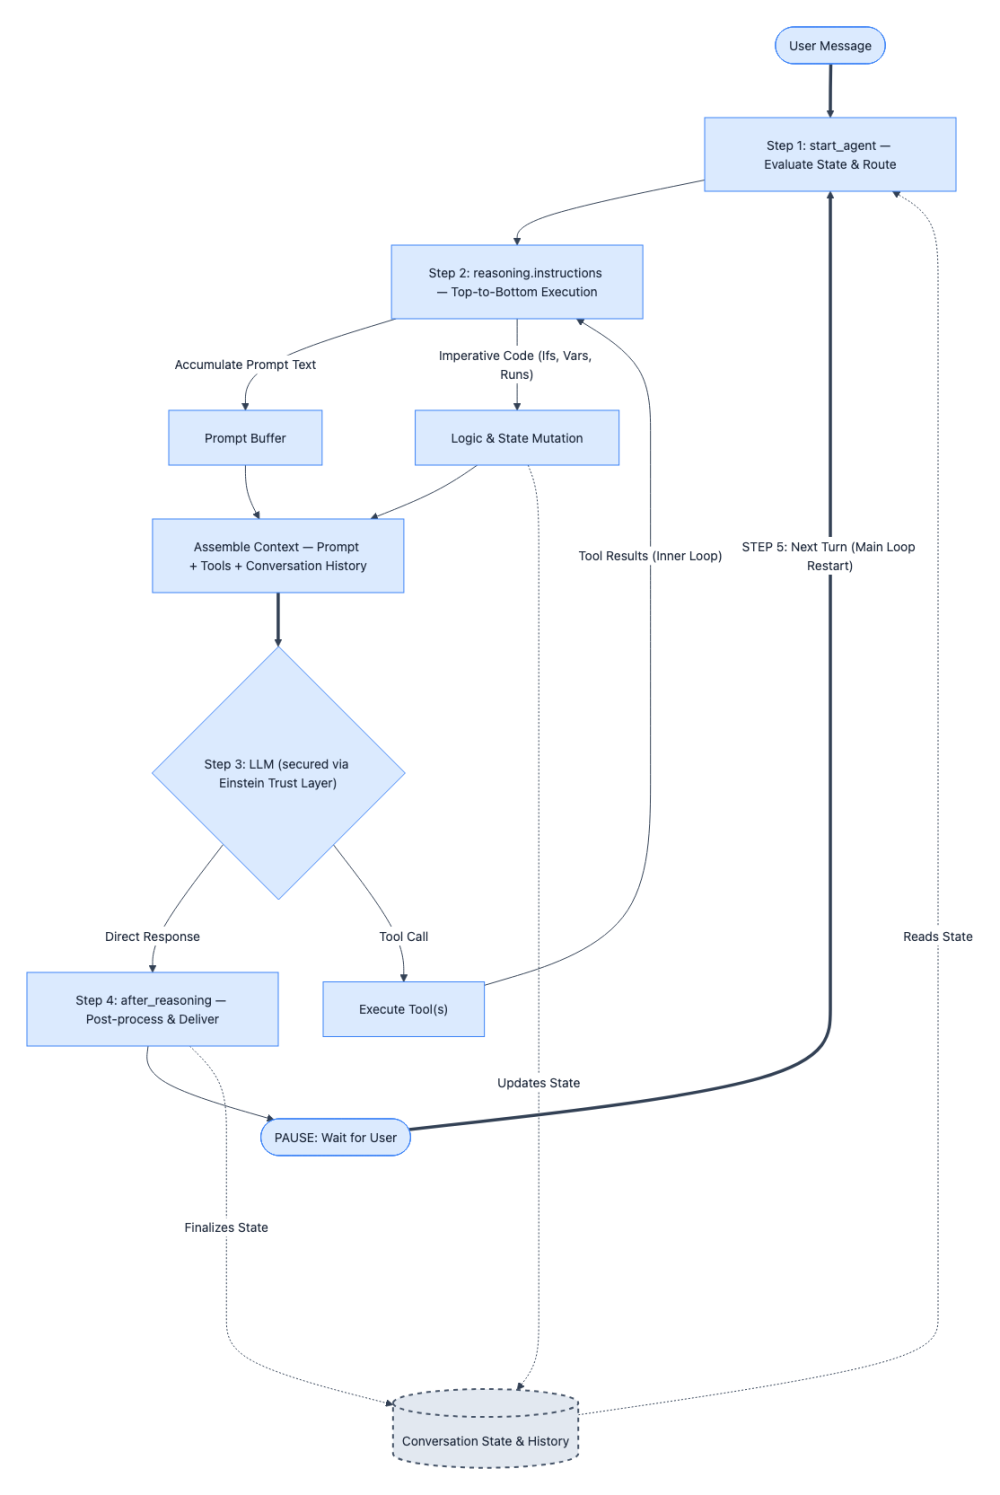
Here’s the step-by-step breakdown of the above execution flow:
Step 1: Every conversation turn starts at start_agent. No exceptions. Regardless of what the user said or where the previous turn left off, the agent’s entry point fires first. Its sole job is to evaluate the current conversation state and route to the appropriate topic.
When debugging, your first question should always be: “Did the agent route to the topic I expected?” If the answer is no, the bug lives in your topic descriptions or conversation state.
Step 2: Once inside a topic, reasoning.instructions execute top-to-bottom — deterministically. This is the part that behaves like regular code. Every if condition evaluates, every run block executes, and every variable assignment completes predictably. Meanwhile, prompt text lines (the ones prefixed with |) don’t execute — they accumulate silently into a prompt buffer. This is a critical distinction: logic runs immediately, prompt text just stacks up. When you’re tracing a bug through instructions, you can reason about this phase the same way you’d step through any imperative program.
Step 3: The assembled prompt and available tools are handed to the Large Language Model (LLM) secured by Einstein Trust Layer. This is where execution shifts from deterministic to non-deterministic. The LLM secured by the Einstein Trust Layer receives everything the instructions phase built up — the accumulated prompt text, the conversation history, and the list of tools from reasoning.actions — and reasons over it. It may respond directly, or it may call one or more tools. You cannot predict this phase with certainty, but you can inspect what went in (the assembled prompt) to understand why the LLM reasoned the way it did. After each tool execution the system loops back to Step 2 to re-evaluate the prompts and the cycle repeats until the LLM gives a direct response without any tools.
Step 4: after_reasoning runs (if defined), and the response goes to the user. Any post-processing logic executes, the agent delivers its response, and then it waits. The cycle is paused — not finished.
Step 5: The user sends another message, and the loop restarts from Step 1. This is the muscle you need to build: at every turn boundary, ask yourself “What variables changed? How did the conversation state shift? Will the start_agent route be different this time?” Multi-turn bugs almost always live in these transitions — a variable that didn’t update or a routing condition that no longer matches. Remember that agent variables are like global states and they are preserved between each turn.
Debug Agent Script with Agentforce Builder
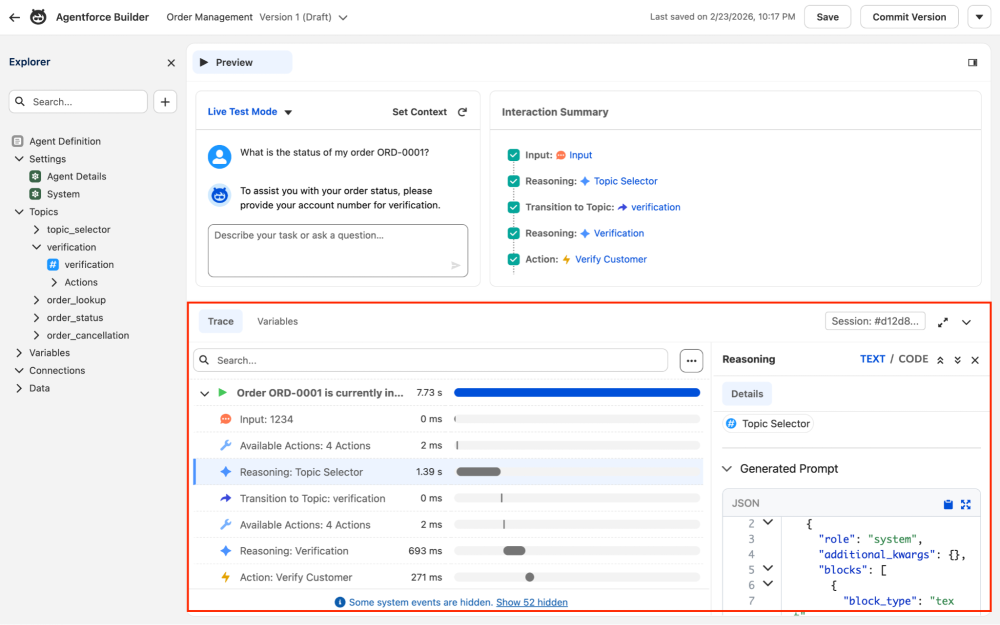
You can debug and trace the execution flow of your agent using the new Agentforce Builder. Within Agentforce Builder, you can use Simulate mode for testing without risking any changes to your actual data or Live Test mode for real action testing, both of which provide an Interaction Summary panel to trace your agent’s conversation logic, topic transitions, and triggered actions.
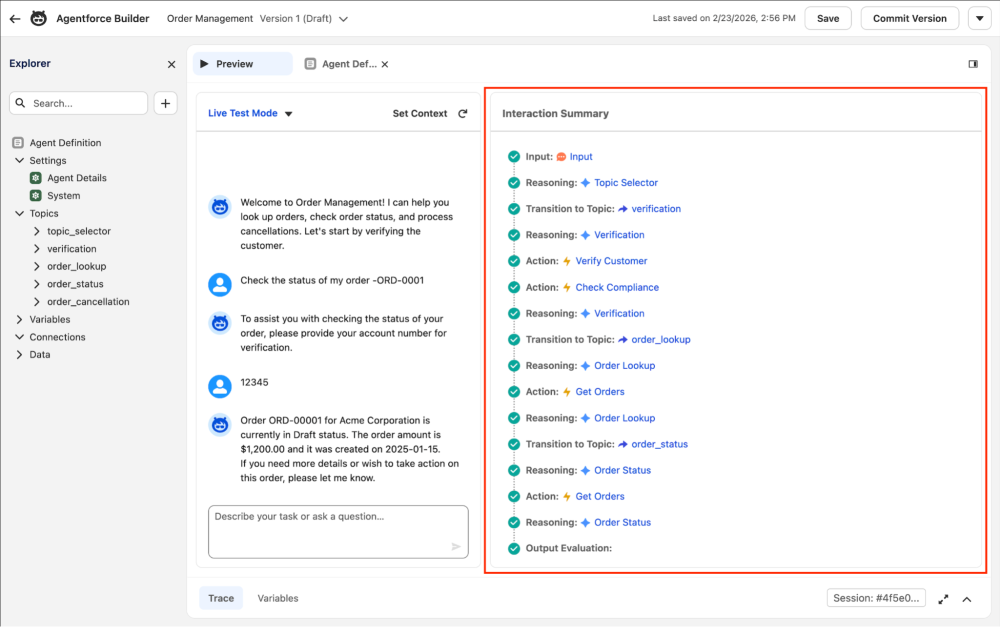
The Interaction Summary panel shows you each step in sequence — Input, Reasoning, Topic Transitions, Actions, and Output Evaluation — all as a clean visual timeline. It’s excellent for getting an overview of the conversation flow, and also where things went wrong.
When you need to go deeper, expand the Trace tab (see screen shot below) at the bottom of Agentforce Builder. This breaks down every millisecond of the interaction, with timing bars so you can see where time is spent. You can click on each interaction to discover the details like the dynamically generated prompt sent to the LLM.
If you need to inspect variables, you can switch to the Variables subtab to peek into the variable values at each step.
Debug Agent Script with Agentforce DX
If you prefer working in an IDE like Visual Studio Code, the Agentforce DX extension gives you the same tracing capability directly in your editor via the Agent Tracer tab. The screenshot below shows the Agent Tracer tab.
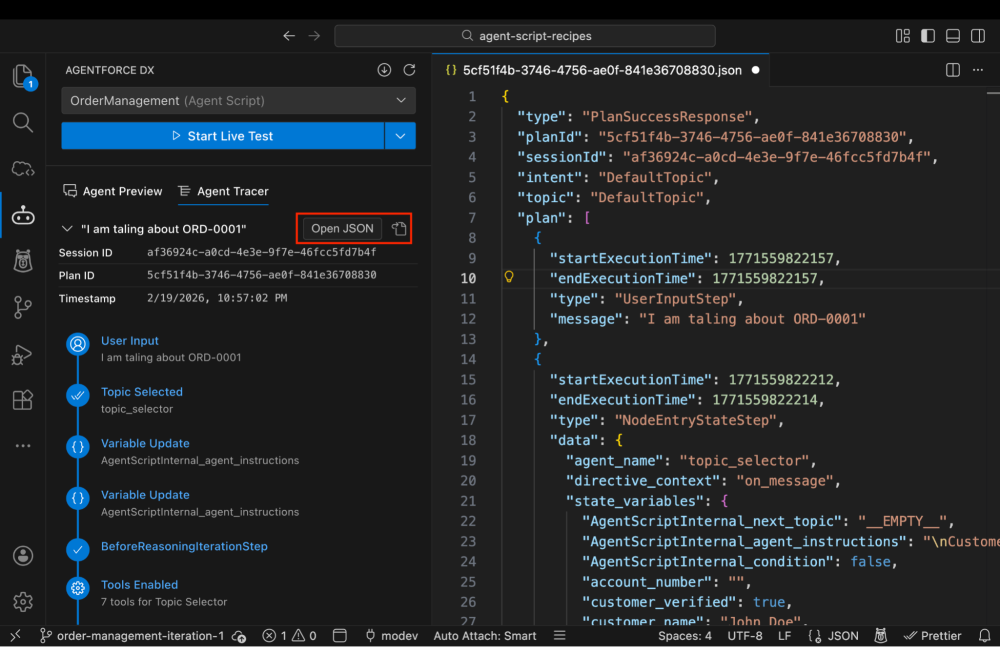
The left panel shows you the full execution plan: User Input, Topic Selected, Variable Updates, Tools Enabled, Reasoning steps, Topic Transitions and more.
You can click on any test conversation, and hit the open file icon (highlighted in red) to view the complete raw plan response for any conversation turn. The JSON is your ground truth. It contains every state variable value at every point in the execution— including internal Agent Script variables making it invaluable for diagnosing subtle logic issues.
Vibe Debugging Agent Script
While Agentforce Builder and the Agentforce DX extension offer incredibly detailed execution traces, analyzing that data step-by-step has traditionally been a self-guided exercise. It is time to lean into a new workflow: vibe debugging.
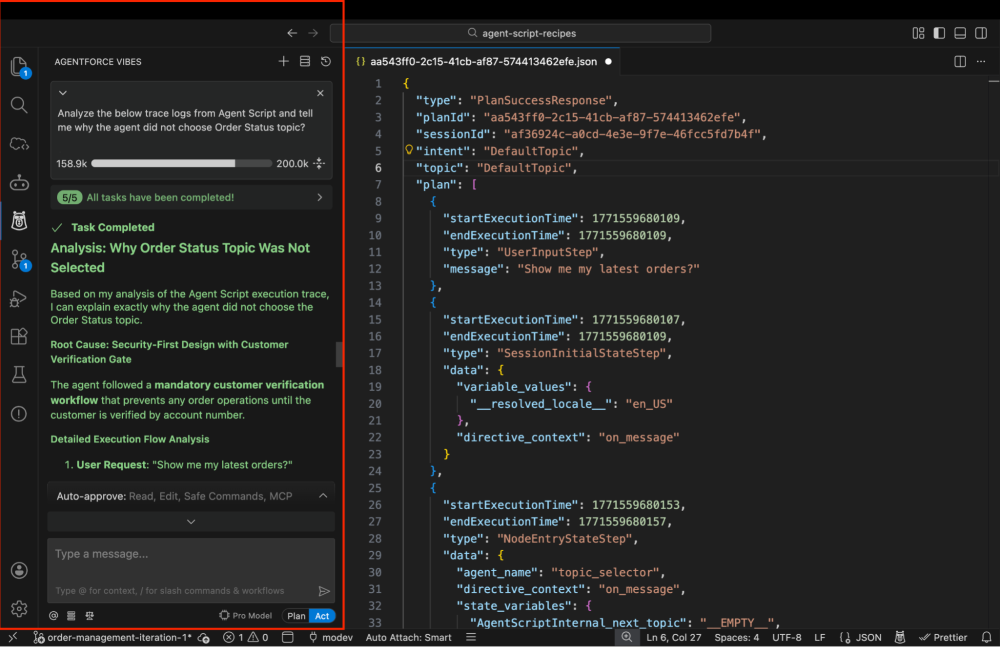
Instead of navigating the builder UX to diagnose a misstep, you can bring in Agentforce Vibes as an AI pair programmer to walk the trace for you. Just simulate a conversation turn in VS Code, copy the JSON execution trace from the Agent Trace tab, and paste it into Agentforce Vibes and prompt your expected outcome. Agentforce Vibes instantly spots unexpected topic routing, overwritten variables, or prompts that nudged the LLM off course, and suggests concrete code updates directly for your Agent Script.
To power this AI-assisted workflow, context is everything. You need to equip Agentforce Vibes with the exact blueprint they need to understand Agent Script syntax and reasoning loops. You can easily do this by adding two lightweight files to your repository: a rules file like .airules/AGENT_SCRIPT.md and an AGENTS.md index file at the root. You can grab working examples from the agent-script-recipes repository to jumpstart this setup.
With these rules in place, debugging evolves from a solitary investigation into a fluid, conversational workflow where you can rapidly test hypotheses and let Vibes iterate your Agent Script in your supervision. Because this approach relies on a universal contextual foundation, you can adopt the discussed workflows with other AI coding agents like Claude Code, Cursor or any other tools you use giving you unparalleled flexibility in how you debug and iterate your Agent Script.
Conclusion
Debugging Agent Script might sometimes feel like wrestling with a black box, but by leveraging the execution traces in Agentforce Builder and the Agentforce DX extension, you can stop guessing and start diagnosing.
The key to mastering agent development is trusting the data over your intuition. Keep the execution loop mental model top of mind: remember that start_agent always routes first and treat your step-by-step code and your prompt text as two completely separate things. By separating your strict logic from your prompts and verifying the exact context handed to the LLM, you can quickly resolve issues. Whether you are tracing a variable drift manually or relying on Agentforce Vibes to untangle a complex JSON trace, you have a complete toolkit to build reliable, intelligent agents. Next time your agent goes off-script, dive into the trace logs and follow the data.
Resources
- Agent Script Recipes Sample App
- Agent Script Decoded Video Series
- Agent Script Documentation
- Agentforce Guide
About the author
Mohith Shrivastava is a Principal Developer Advocate at Salesforce with 15 years of experience building enterprise-scale products on the Agentforce 360 Platform. Mohith is currently among the lead contributors on Salesforce Stack Exchange, a developer forum where Salesforce Developers can ask questions and share knowledge. You can follow him on LinkedIn.