Salesforce is committed to continuously improving Lightning Experience performance for your orgs. Over the last few years, we have delivered and transparently shared measurable gains across releases—from a 12% improvement in the first year of this effort to announcing at Dreamforce 2024 that Lightning Experience was 25% faster. Most recently at Dreamforce 2025, we announced that performance has improved by 37%. All the while, we continue to invest in these gains to ensure they are permanent by preventing performance regressions in Lightning Experience.
However, improving performance at scale is only part of the story. As Lightning Experience becomes faster overall, there is a growing opportunity to optimize performance within individual orgs based on their unique usage patterns and configurations. This is why our focus is expanding: alongside continuous platform-level improvements, we are providing developers with better tools to understand, diagnose, and improve Lightning Experience performance within their own environments.
At Dreamforce 2025, we took a major step forward by launching Lightning Experience Insights in Scale Center as a Beta feature. With the Spring ’26 release, we are excited to announce that these insights are now Generally Available (GA).
Introducing Salesforce Scale Center
Salesforce Scale Center is your central hub for understanding how your org behaves at scale. It provides self-service, near real-time access to performance metrics to improve the scalability of your Salesforce implementation. Scale Center brings together performance, reliability, and usage insights to help developers proactively identify risks, prioritize optimizations, and operate their orgs with confidence as they grow.
Scale Center has powerful root cause analysis, enabling you to resolve issues earlier in the development cycle. This analysis works by retrieving customized insights and diagnosing root causes or “hot spots.” In addition to identifying hot spots, Scale Center provides recommendations for addressing them.
Scale Center offers a unified, curated view of how your org performs under real-world conditions across users, pages, and customizations. This visibility allows developers to move from reactive troubleshooting to intentional, proactive performance management.
As of Dreamforce 2025, Scale Center is available for all major editions. It continues to expand with new insights tailored to the most critical scaling challenges on the Salesforce Platform, including our newest addition: Lightning Experience Insights. These insights are specifically designed to help you understand and improve your individual Lightning Experience performance.
Lightning Experience Insights: Turning Data into Action
Lightning Experience Insights in Scale Center are built with a singular goal: to help developers understand and optimize their org’s performance. These insights move beyond aggregate platform metrics to focus on the actual user experience, providing the data necessary to take specific, impactful action.
With the Spring ’26 release, Lightning Experience Insights are Generally Available. Moving beyond its Beta phase, this version features expanded coverage, clearer guidance, and deeper integrations across Scale Center.
Let’s explore the key components of Lightning Experience Insights.
Performance Overview
The Performance Overview in Lightning Experience Insights provides a clear, high-level view of how Lightning pages perform across your org. It enables developers to quickly assess overall Lightning Experience performance before diving into granular details.
At the center of this view is Lightning Experience Page Time (EPT), the primary metric Salesforce uses to measure Lightning page load performance. EPT represents the total time required for a page to load into a state where a user can fully interact with it.
A lower EPT indicates faster page loads and provides a better user experience. We use the industry-standard 75th percentile (P75) to calculate the EPT, which represents the time it takes for 75% of pages to load for your users. By focusing on the P75, we identify issues affecting the majority of your user base, providing a more accurate reflection of how real-world performance impacts your customers.
Ultimately, the Performance Overview helps developers quickly answer a fundamental question: Is Lightning Experience performing well for our users, or is further investigation required? It highlights overall health and surfaces specific areas where your attention is needed most.
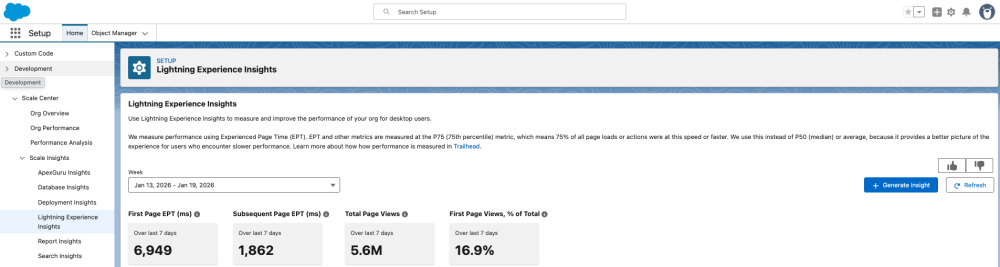
To reflect the actual user journey, EPT is categorized into First Page Load EPT and Subsequent Page Load EPT. First Page Load EPT captures the initial experience when a Lightning session starts, while Subsequent Page Load EPT measures performance as users navigate between pages.
The initial page load typically takes longer than subsequent page load because it includes both the complete page render and the initialization of the framework, also known as the Lightning Experience Bootstrap. Once the framework is initialized, subsequent page load times are generally faster because they do not need to reload the core framework during navigation.
Viewing these metrics together—and analyzing their distribution—enables developers to identify which optimizations have the greatest impact. Whether the goal is to improve the user’s initial entry into Lightning or to make everyday navigation faster and more responsive, these insights help you prioritize optimizations where they matter most.
Key Insights and Best Practices
The Key Insights section is your starting point for understanding Lightning Experience performance in your org. Rather than surfacing raw metrics, it highlights where Lightning pages may be deviating from recommended performance best practices, helping developers focus on the areas with the greatest impact.
Key Insights provide visibility into whether your Lightning Experience is structured for speed and responsiveness. For example, pages with an unusually high number of components can lead to slower load times. Key Insights flag these early so developers can optimize page composition to improve performance.
Key Insights also evaluate whether your org is utilizing available performance optimizations designed to support Lightning Experience performance. Key Insights highlight settings and capabilities, such as Lightning CDN, that help jump-start the Lightning framework and are developed to improve First Page Load performance.
Seeing the optimizations available, together with areas that can benefit from the optimizations, makes it easier for developers to understand where and how to implement performance best practices across their orgs.
These examples represent only a subset of the insights available. Key Insights covers a range of best practices across configuration and page design, giving developers a comprehensive view of how to strengthen Lightning Experience performance.
Performance Trends
The Performance Trends section helps developers understand how Lightning Experience performance changes over time. It visualizes your org’s Experience Page Time (EPT) for a selected period, making it easier to spot patterns, shifts, and anomalies in page load behavior.
Additional charts in this section break EPT down across common dimensions such as geography and browser, providing context into where performance may vary for different users. When not explicitly separated, EPT reflects a blended view of first and subsequent page loads and is referred to simply as “EPT.”
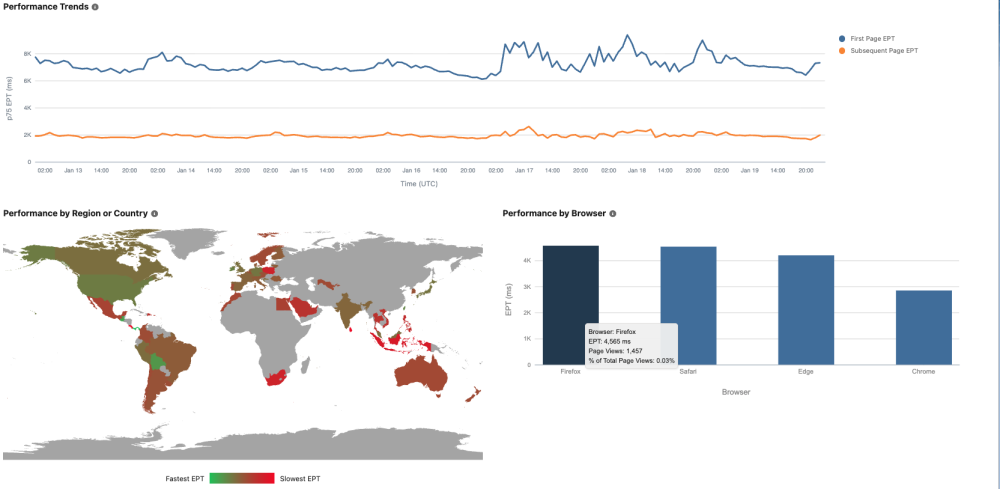
This specific definition excludes Lightning Experience bootstrap and combines only non-bootstrap EPT from both first and subsequent page navigations. Because bootstrap performance isn’t directly actionable, this metric represents the portion of page load time that developers can meaningfully influence. It also provides a simplified baseline for further breakdowns across geographies, browsers, and slow-performing pages.
Viewing trends this way helps developers quickly determine whether performance changes are isolated—affecting a specific region or browser—or reflect broader shifts across the org.
Actionable Insights for Slow Pages
Finally, developers can connect performance signals to concrete opportunities for specific page optimization. The High-Impact, Slow-Performing Pages view identifies pages that are both slow to load and frequently accessed, highlighting areas where performance issues most significantly affect users. These pages are the highest priority because their latency impacts a significant portion of your org’s daily activity.
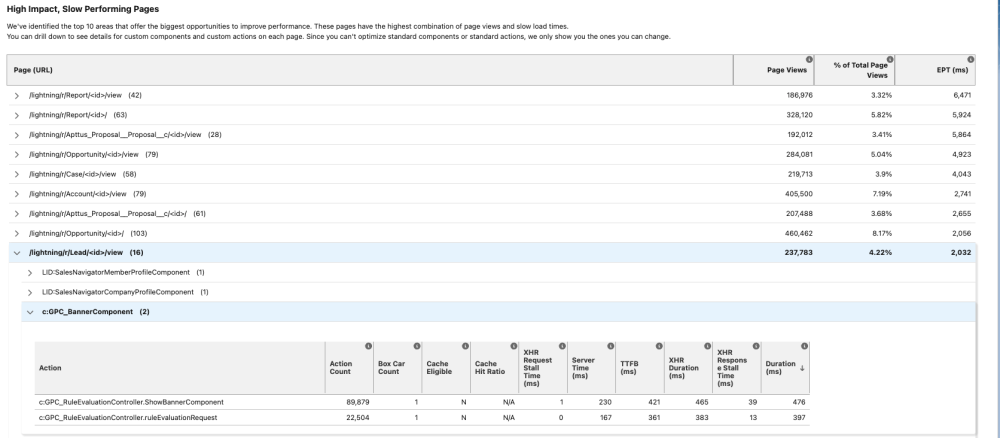
For each high-impact slow page, Lightning Experience Insights surfaces the underlying custom components and actions contributing to longer load times. Developers can use this information to pinpoint the exact elements causing delays. With targeted visibility, developers can prioritize the optimizations that have the biggest effect on the real-world user experience.
By combining usage and performance data, this view ensures developers focus on the slow pages that matter most. It enables faster, more precise action instead of guesswork or broad refactoring, turning insights into measurable improvements for your org’s Lightning Experience.
Looking Ahead: Faster Lightning, Smarter Insights
Salesforce remains deeply committed to advancing Lightning Experience performance. Simultaneously, we are investing in tools that give developers greater visibility and control over performance within their own orgs.
Our goal is to empower developers to understand and optimize performance confidently as Lightning continues to evolve. With that in mind, Lightning Experience Insights in Scale Center will continue to expand and become smarter, deeper, and more actionable.
Together, these platform innovations and customer-facing insights ensure you have the resources needed to deliver fast, responsive Lightning Experiences your users expect.
Resources
- Our Details Plan to Improve Lightning Experience Performance
- Lightning Experience Performance: First Anniversary, Results, and Outlook
- Announcing 25% Faster Lightning Experience
- How Salesforce Secures Lightning Performance Gains by Preventing Regressions
- Scale Center in Salesforce Help
- Lightning Experience Insights Generally Available Release Note
- Lightning Experience Insights in Salesforce Help
- Lightning Experience Performance Optimization in Trailhead
About the authors
Gery Gutnik is a Senior Director of Product, focusing on the performance and scale of the Salesforce web platform. His work spans Lighting Experience performance, content delivery networks (CDN), and performance observability tools. He can be reached at LinkedIn.
Ravi Raina is a Director of Product, working on the Scalability Products portfolio. He can be reached at LinkedIn and X (Twitter).