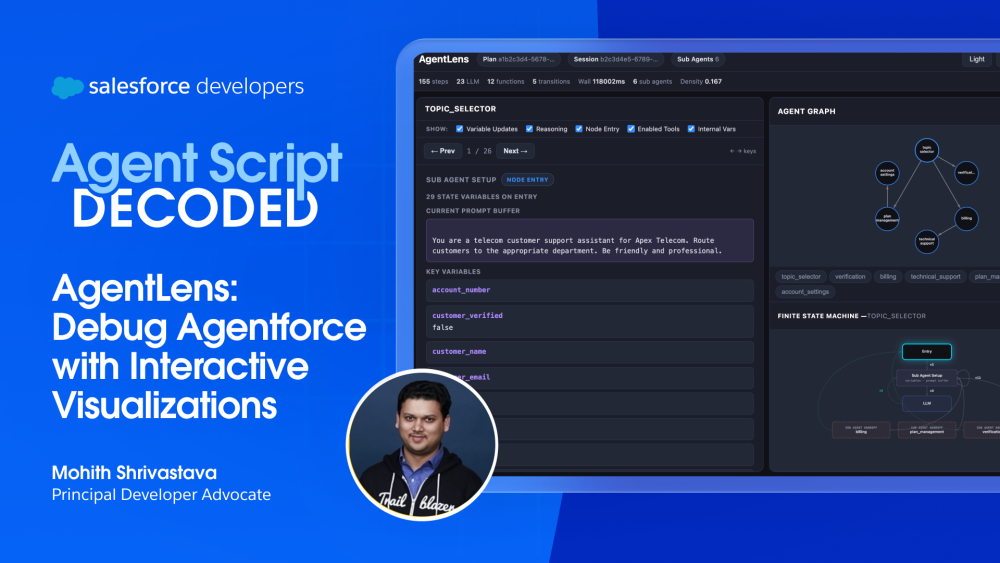
AgentLens is an open source tool that transforms Agentforce traces into interactive visualizations, such as agent graphs, finite state machine (FSM) diagrams, and step-by-step execution inspectors, so you can debug Agent Script orchestration in minutes. It has zero dependencies, runs entirely offline, and keeps all trace data on your machine.
I built AgentLens when I was writing Agent Script recipes, the declarative definitions that control how Agentforce route, respond, and invoke tools. I needed a way to quickly debug what my agents were doing during execution in order to build a clear mental model of their orchestration. Whether I was reviewing agent behavior, or instructing a coding agent like Agentforce Vibes or Claude Code to modify Agent Script, I needed to understand the flow. Which subagents talked to each other? What does the state machine look like inside each one of these subagents? Where do handoffs happen, and why?.
Agentforce already provides a powerful agent platform tracing capabilities. Every execution is captured — subagent routing, LLM calls, tool invocations, variable mutations, all of it. That trace data is rich and complete, but what was missing for me was a fast, intuitive way to visualize it. I wanted a tool that would allow me to build a mental model in minutes, so I could describe orchestration clearly to a coding agent, judge whether its output was correct, or spot patterns in how my Agentforce agents behave.
That’s why I built AgentLens.
How Agentforce orchestration works (and why it matters for debugging)
Before diving into the tool, it helps to understand the two core structures that define how an Agentforce agent executes.
An Agentforce agent is composed of subagents, and each is responsible for a specific capability, such as order lookup, case routing, or knowledge retrieval for an order management agent. When a user sends a message, the orchestrator decides which subagent should handle the request and hands off the conversation. That subagent may invoke another in turn. The result is a directed acyclic graph (DAG), a network of subagents connected by handoff edges, where each edge represents one subagent passing control to another. Understanding this DAG tells you which subagent participated in a conversation and in what order.
Inside each subagent, execution follows a finite-state machine (FSM), a sequence of states connected by transitions. The subagent moves from state to state; it might start by calling the LLM, transition to a tool execution based on the LLM’s decision, then transition to a response or hand off to another subagent. Each state has defined transitions that determine what happens next. Understanding the FSM helps you see not just what a subagent did, but how it made decisions at each step: which tools it invoked, why transitions occurred, and where execution paths diverged.
When you’re debugging an Agentforce agent — or prompting a coding agent to fix one — you’re ultimately trying to answer two questions:
- “Did the right subagents get involved, in the right order?” (the DAG)
- “Did each subagent behave correctly internally?” (the FSM)
The first tells you how the orchestration flowed across the system. The second tells you how decisions were made within each subagent. AgentLens makes both visible.
Visualize agent orchestration at three levels
AgentLens takes a single Agentforce trace JSON file and presents three connected views, each one level deeper than the last.
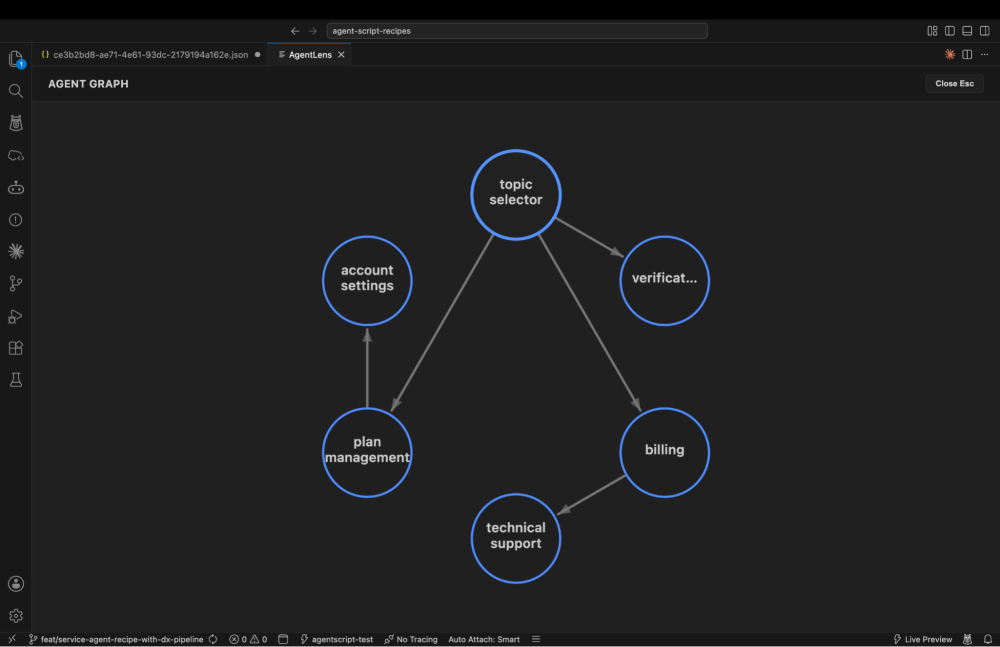
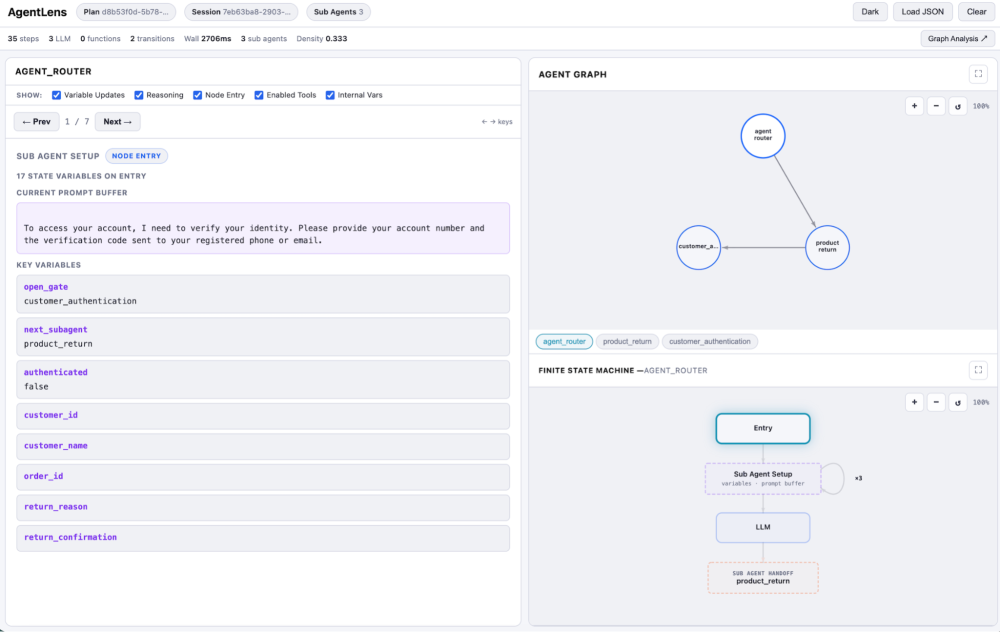
Agent Graph (the DAG): See which subagents communicated and in what order. Each node is a subagent, and each edge is a handoff. The graph shows you the full routing path that the conversation took, making it easy to spot unexpected routing, circular handoffs, or subagents that never got invoked when they should have been.
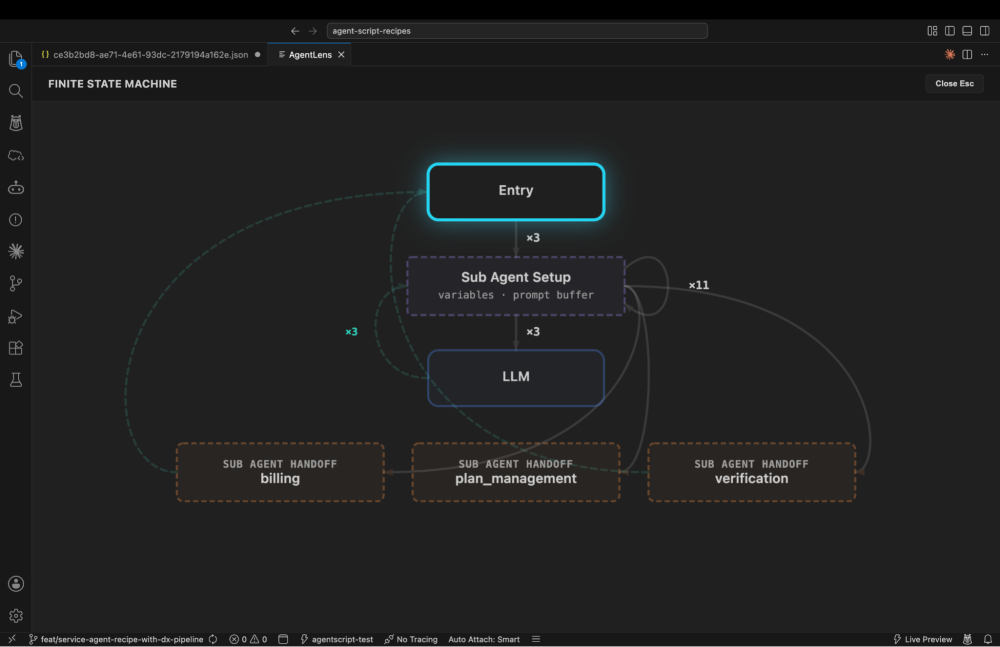
Finite-State Machine Diagram: Pick any subagent and see its internal execution as an interactive FSM. Nodes are color-coded: blue for LLM calls, teal for tool executions, green for responses. Each arrow is a state transition. Backward arrows reveal retries and loops — places where the subagent repeated a step, usually because a tool returned unexpected results or the LLM needed another pass. This is what tells you how a subagent made its decisions, and it’s what you describe to a coding agent when you want it to change the behavior.
In one of my recipes, the FSM showed the Routing subagent handing off to Fulfillment four times in a loop. The backward arrow made the pattern obvious: the handoff condition was matching too broadly. I described the FSM to Agentforce Vibes, and it tightened the guard clause in seconds.
Step-by-Step Trace Inspector: Walk through every agent execution event in sequence: the exact system prompt the model received, what it responded to, tool inputs and outputs, and variable diffs showing what changed. Use the arrow keys to navigate and handoffs automatically jump to the next agent, so you never lose the thread.
Filter controls let you toggle the visibility of variable updates, reasoning steps, enabled tools, and internal system variables. Show only what matters for the question you’re asking.
Debug Agent Script in VS Code or your browser
Analyzing Agentforce execution traces is the best way to understand its internal decision-making process. Let’s look at how you can easily visualize and debug these traces with AgentLens.
VS Code Extension: Search for AgentLens Visualizer in the Extensions panel or install it from the VS Code Marketplace. Once installed, right-click any trace JSON and select Open with AgentLens. You can still search for AgentLens Visualizer in Cursor or other IDEs, since the extension is available on the Open VSX Registry.
If your traces live at .sfdx/agents/**/traces/*.json (the default location used by the Salesforce CLI), the extension automatically adds an inline Open in AgentLens CodeLens at the top of the file. AgentLens also integrates with your VS Code theme, with support for light, dark, and high-contrast modes.
Web App: Head to msrivastav13.github.io/AgentLens, paste or upload a trace, and you’ll immediately see the agent graph — no install needed.
For full offline use, download the index.html from the GitHub repo, open it in your browser, and paste the trace JSON from Agentforce Builder. Everything runs locally on your machine, and no trace data leaves your environment.
Where do Agentforce traces come from?
You can export traces from several places in the Agentforce ecosystem:
- SF CLI: Run
sf agent preview -o <org>. Traces save to .sfdx/agents/ in your project. - Agentforce DX Extension: Copy the plan response JSON directly from the trace viewer.
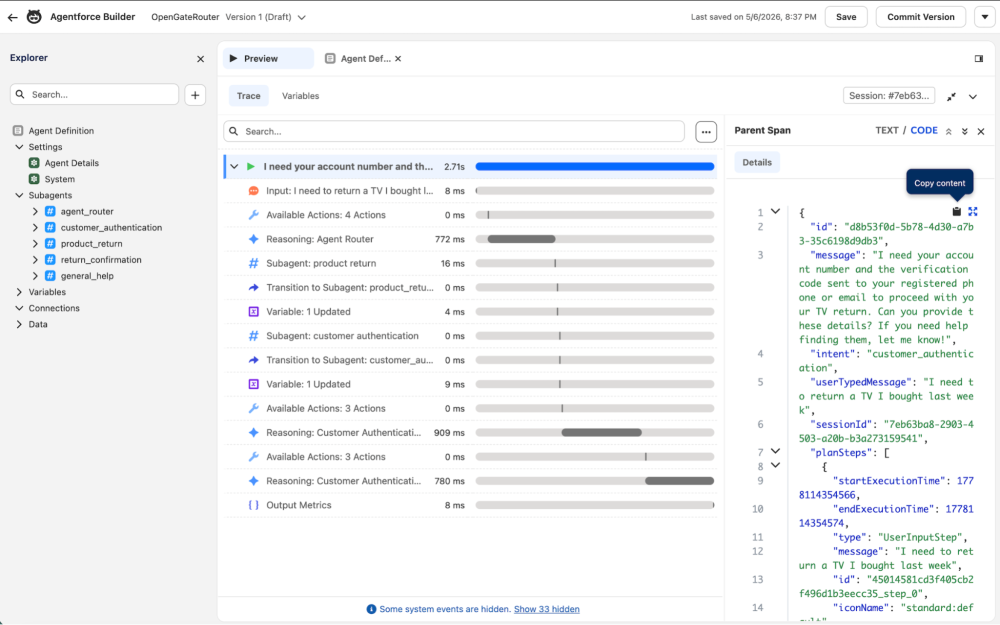
- Agentforce Builder: Run a conversation in the preview panel, then copy the trace JSON from conversation details.
The screenshot below shows how to copy trace JSON from the Agentforce Builder trace panel.
Once you’ve copied the trace, simply paste it into the AgentLens user interface to visualize the agent graph and step through the execution trace interactively. The screenshot below shows how AgentLens transforms the raw JSON copied from Agentforce Builder into an interactive debugging experience.
Development versus production: Pick the right tool
AgentLens is designed for the development loop, when you’re iterating on Agent Script, testing behavior in preview, and refining how your agent orchestrates. It helps you understand what happened in a test run, so you can make the next change with confidence.
For production observability, monitoring live agent conversations, tracking performance, and diagnosing issues in deployed agents, use Agent Platform Tracing. That’s the built-in platform capability for tracing agent execution at scale in your org.
A useful way to think about it:
- AgentLens is the workbench microscope you use while building
- Agent Platform Tracing is the production dashboard you use after shipping
Get started with AgentLens
AgentLens is open source and MIT licensed on GitHub. Try it on your own Agentforce agent traces, and if there’s a visualization that would help you debug faster, or a feature you’d like to see added, open an issue.
I built AgentLens because feedback loops matter. Whether you’re debugging Agentforce agents yourself or prompting a coding agent to do it for you, having a clear mental model changes how effectively you work. You write better prompts, catch orchestration issues faster, and gain a deeper understanding of how your agents actually behave.
Resources
- AgentLens web app
- AgentLens VSCode extension
- AgentLens open source repository
- Agent Script Recipes sample app
About the author
Mohith Shrivastava is a Principal Developer Advocate at Salesforce with 15 years of experience building enterprise-scale products on the Agentforce 360 Platform. Mohith is currently among the lead contributors on Salesforce Stack Exchange, a developer forum where Salesforce Developers can ask questions and share knowledge. You can follow him on LinkedIn.