Troubleshooting Salesforce B2C Commerce Performance
When you face performance problems, the following guidelines and steps help resolve the issue without needing to contact your support provider. However, if you still need assistance, the gathered information is helpful while raising a case. Use the Pipeline Profiler and Reports & Dashboards to monitor and review deployed code performance, and identify or prevent performance problems. When a performance issue occurs, take several steps to identify the cause and quickly resolve the issue. Grid-wide median responses for the most critical pipelines are:
-
Search-Show : 400 ms
-
Product-HitTile : 10 ms
-
Product-Show : 300 ms
-
Home-Show : 90 ms
-
Page-Show : 90 ms
-
Cart-Show : 400 ms
-
OCAPI-Request* : 250 ms
*Catch-all for OCAPI requests. View statistics in the CCAC Technical Dashboard.
If the response times for these critical controllers are around the mentioned median response time, the site is scalable. Validate the controller response time by executing the Pipeline Profilers or CCAC Reports and Dashboards.To analyze and narrow down the line of code causing the issue, use Pipeline Profiler. Note: The end to end response time of any controller, as measured by external monitoring tools, is expected to be much higher as it depends on network, browser rendering, and so on.
Pipeline Profiler
When you push a new version of your storefront code, or receive a new B2C Commerce version, monitor performance to see if the new code affects it with the Pipeline Profiler. Also monitor job performance and search indexing, and optimize when possible.
- To access the Pipeline Profiler, navigate to Business Manager. Click App Launcher
 and then select Administration > Operations > Pipeline Profiler.
The Pipeline Profiler displays a high-level view of response times per script, such as hits, total time for a page to be generated, and average time. Use the Pipeline Profiler to identify the most expensive pipeline or controllers, and the most expensive component within that pipeline or controller. Drill down into script data within a pipeline or controller to identify expensive scripts running on the storefront.
and then select Administration > Operations > Pipeline Profiler.
The Pipeline Profiler displays a high-level view of response times per script, such as hits, total time for a page to be generated, and average time. Use the Pipeline Profiler to identify the most expensive pipeline or controllers, and the most expensive component within that pipeline or controller. Drill down into script data within a pipeline or controller to identify expensive scripts running on the storefront. - Look for scripts with high average run-times and high hit-counts. These are the first metrics to focus on for troubleshooting performance.
- To view more detailed data for a specific script, click the script name.
While the profiler is running, similar metrics are provided for all Server-Side JavaScript (whether it is in a script file, in an ${expression}, or between <isscript> tags). When you stop the profiler, script data is no longer provided.
Look at the pipeline technical reports to identify which recent code deployments are related to performance issues. If a new script or pipeline was recently deployed, roll back the code. Use a code replication of type Undo, or change the active version in production.
Code Profiler
The Code Profiler provides insight into run-time performance. Unlike Pipeline Profiler data, the information is kept and can be exported. For more information, see Using Code Profiler. Are you currently facing a performance issue? Use the following information to troubleshoot in real time or review the performance of your site.
We recommend you follow a sequential approach to narrow down the origin of the issue before reaching out to support. The following documentation leads you towards a possible root cause and solution for your real-time performance issue.
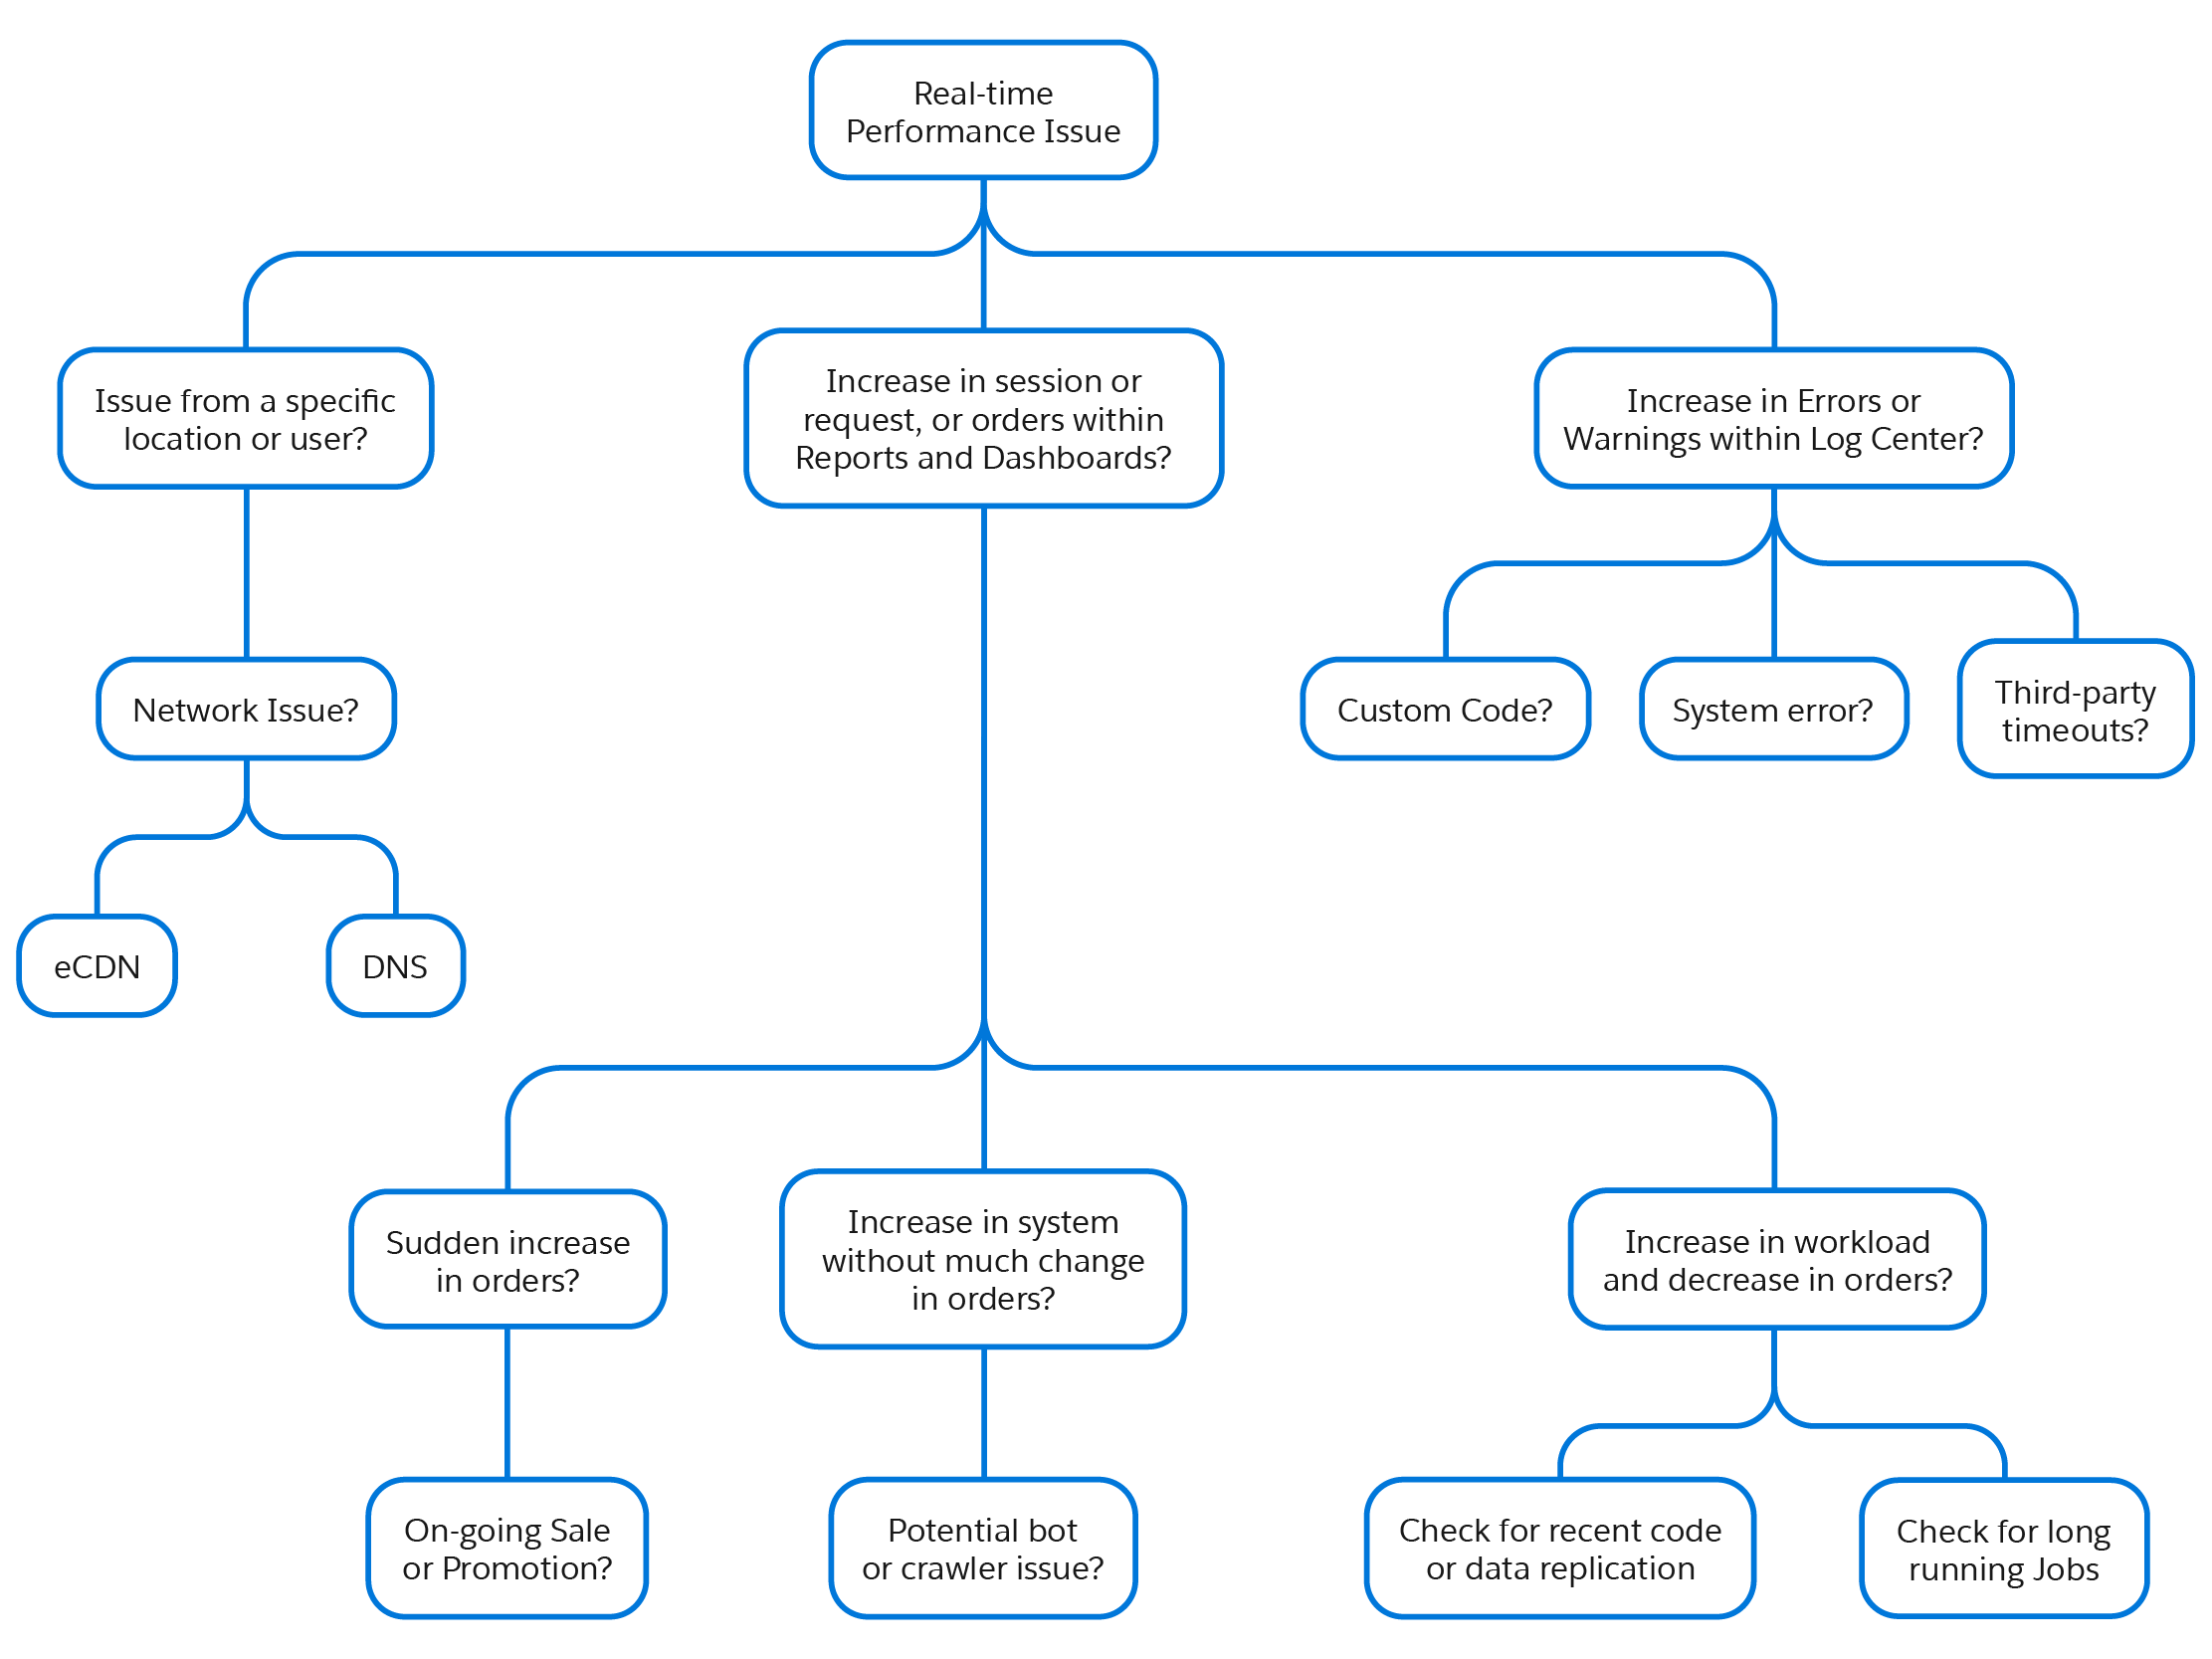
Specific Location or User Issues
To check for B2C Commerce disruptions or service degradations, check the Trust Status Page.
Note: If the issue is only seen from a specific location, or the whole internet is slow, it’s highly likely to be a local network issue.
Check the following issues and record the answers for communication with technical support:
- Is the slowness seen by a single user, a specific location, or is it seen sporadically across the regions?
- Are you seeing slowness only on the B2C Commerce storefront, or on other external websites?
- Is this slowness common across all instances, or restricted to one instance?
- Is the slowness reported for a specific page, search result, component, or across the site?
- Is the slowness reported by an actual user or by a monitoring bot?
- Is the issue seen all the time or happening sporadically?
- Is the issue happening at a specific time of day?
Verify Network Issues
To verify network issues, consider the following:
- Check for a browser proxy. If that doesn’t resolve the issue, then contact your network administrator.
- Perform a
traceroute. This can identify a bottleneck in your network chain. - Run a Firebug analysis. Check the network view to do analysis of requests with long response times.
- Waiting Time: If waiting time is highest in the graph, the issue is most likely on the server-side and the code needs further investigation.
- Receiving: If receiving time is highest in the graph, the issue is probably with a local network or browser.
- Connecting: If a request spends a long time connecting, it often indicates a network issue.
- Check eCDN or DNS in Business Manager by clicking App Launcher and then selecting > Administration > Sites > Embedded CDN Settings.
Use the Real-Time Performance tab in Business Manager by clicking App Launcher and then selecting Merchant Tools > Analytics > Reports and Dashboards (New!).
Sudden Increase in Orders
- Is there an on-going Sale or Promotion?
- Is there a case raised with Support regarding this sale event?
- If it’s a promotion, make sure there is no email blast with unique URL parameters.
- Are the promotions configured optimally by category rather than a list of applicable products?
Increase in System Workload Without Significant Order Change
- Do you have a potential bot or crawler issue?
- Check the eCDN settings for WAF rules in Business Manager by clicking App Launcher and then selecting Administration > Sites > Embedded CDN Settings.
- Consider Rate Limiting or Captchas.
Increase in System Workload and Decrease in Orders
- Check for recent code or data replications if the time matches.
- Is there an issue with Cache Clear?
- Cache Clears can lead to suboptimal performance during high traffic.
What Can Cause a Cache Clear?
- Code replication, code activation, and data replication clear the cache unless you specify not to in the job. If the cache isn’t cleared, however, replicated data isn’t shown on the storefront until pages refresh their cache normally. Note: Unlike most other types of data replication, geolocation data and coupons don’t clear the cache.
- Manually clearing the cache.
iscachetags of typedailyin your storefront pages clear all pages of a specific type at the same time every day.
Common Caching Mistakes
- Invalidating cache just before an expected sales peak.
- Invalidating cache several times throughout the day just to bring a specific product or small number of changes online. If that happens frequently, investigate page cache partitioning.
- Invalidating page cache just to bring a piece of static content online.
Changes During Replication
- Have any site or global preferences changed?
- Have there been any recent changes to catalogs or integrations?
- Have there been any changes to promotions, slots, or content assets?
Long Running Jobs?
Check for long running jobs that can be causing thread exhaustion.
- Navigate to Business Manager. Click App Launcher and then select > Administration > Site Development > Development Setup > Log Center.
- Select the current date, and errors and warnings to assess the pattern. If required, select up to the previous 4 days in order to assess the pattern.
Potential Causes
- Custom code Are the errors related to custom code? Check for recent code releases or activation. Work with the Development team to debug the recent code.
- System error If errors are related to the system, fetch log and raise a case with support.
- Third-party timeout Verify the respective web services and refer to Configuring Web Services in Business Manager.
- Resource Lock Some tasks or jobs are prioritized in their capability to lock resources on a higher level. For example, if a job has the right to lock the site’s resource it will automatically release all underlying resources before. So now the workflow job loses the exclusivity of the assigned locks and will fail as it isn’t able to get the resources again (as it is currently locked by an overlying job). To prevent the correlation between such jobs, determine which jobs are affecting others and if it is possible that the other jobs are locking the needed resources. This can be done by reviewing the Job History to see if possible system and custom jobs are running longer than without the own job before. Search in the log center by ‘resource lock’. If the own defined job is failing regularly, and is followed by a system job, contact B2C Support to reschedule the system job to a runtime which wouldn’t interfere with the workflow job. If the locking is due to a custom job, consider rescheduling to avoid overlapping.
We recommend you follow a sequential approach to narrow down the origin of the issue before reaching out to support. The following documentation leads you towards a possible root cause and solution for your general performance issue.
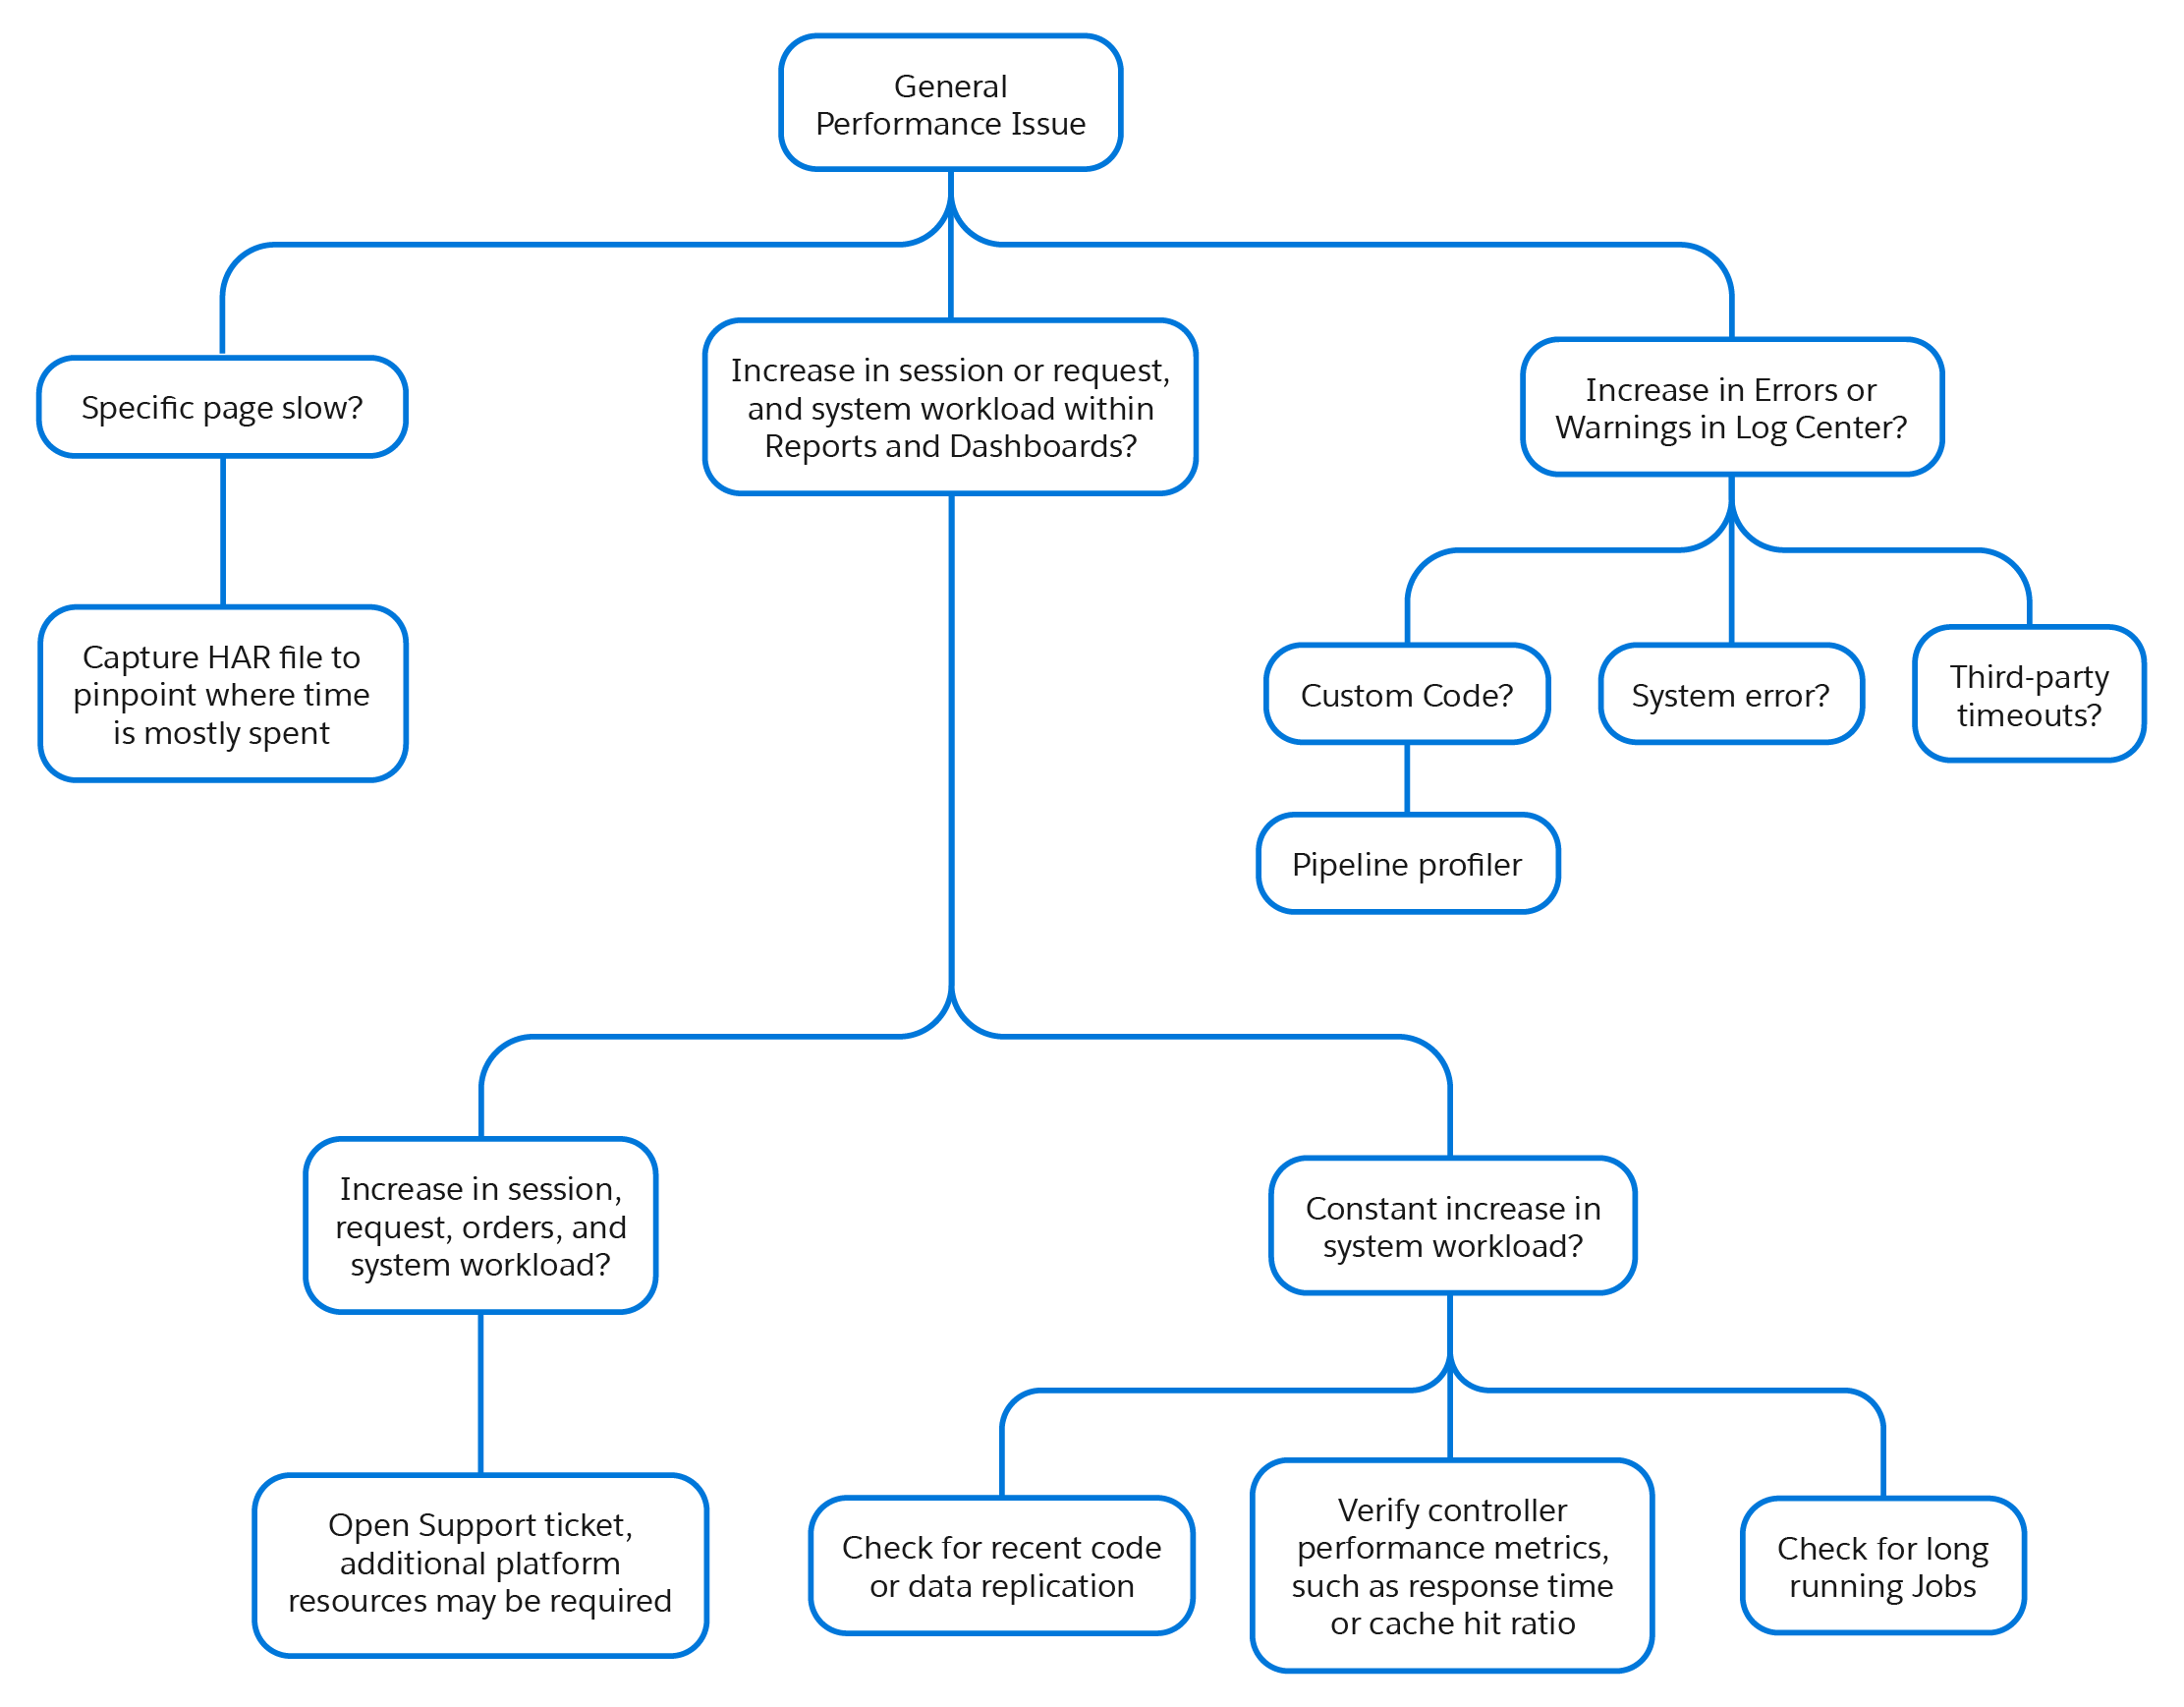
Specific Page Slowness
Capture an HTTP Archive (HAR) file to pinpoint where the time is spent. A HAR file contains lots of trace information from within a browser. It records all web requests made by the browser tab, including the request and response headers, the body, and the time it took to load. HAR files are useful when troubleshooting issues relating to speed, caching, and issues that are harder to replicate.
If you see an increase in session or requests, system workload, and orders, reach out to the support team with information on the workload increase. Your realm resourcing can be fine-tuned, if necessary. Order Throughput Remains the Same Potential Bot or Crawler Issue
- Navigate to Business Manager. Click App Launcher and then select Merchant Tools > Analytics Reports and Dashboards (New!) > Traffic tab > Top Robots.
- Validate the trend of bots, and the number of bots compared to actual storefront visits.
Verify Controller Performance Metrics
- Navigate to the Technical Tab in Business Manager. Click App Launcher and then select Merchant Tools > Analytics Reports and Dashboards (New!) > .
- Verify Controller performance metrics such as cache hit ratio, response time, and OCAPI Response.
- Select Main Controller Requests, sort the requests in descending order, and show the controllers that have been requested the most and with high response time. Click into the controllers and view remote-includes controllers to understand where the time is most spent.
- For OCAPI controllers, check the OCAPI Tab and sort based on request and response time.
Long Running Jobs
To monitor job runtimes, navigate to Business Manager. Click App Launcher and then select Administration > Operations > Jobs.
We recommend monitoring jobs regularly, and to analyze any jobs running over one hour to identify possible optimizations. Data import best practices:
- Don’t include static data (resources) in daily scheduled backups. A site can be exported without static content.
- Run impex jobs sparingly.
- Keep a main record of median job runtimes.
- Calculate the job load factor: total number of seconds job execution time on an instance on a day, divided by 86,400 (number of seconds in a day).
- When modifying objects, always favor standard imports over customizations.
- Design impex jobs so that they recover automatically by recognizing which files haven’t been imported yet during subsequent execution.
- Check for errors in Log Center that may correlate with your issue.
Navigate to Business Manager. Click App Launcher and then select Administration > Site Development > Development Setup > Log Center.
- Check your quotas and deprecated APIs.
Navigate to Business Manager. Click App Launcher and then select Administration > Site Development > Deprecated API Usage.
- Check if you’re experiencing a real-time performance issue flow. Resource lock occurs when two jobs are executed simultaneously, locking on the same resource.
- Check for third-party services for any third-party issues.
Navigate to Business Manager. Click App Launcher and then select Administration > Operations > Services.
Reports and Dashboards can help you drill into insights on technical operations, site traffic, real-time performance metrics, and other aspects of your B2C Commerce sites. If you notice an increase in system workload at a certain time, review what changes were made on the instance at the time such as, code and data deployment, replication, long running jobs, or ongoing sales or promotions. If you notice an increase in sessions or requests without many changes in orders, this can generally point to an issue with BOT traffic. The Traffic dashboard shows data about the visitors to your site, and can be used to investigate issues related to BOT traffic, which may be causing performance issues to your site. Performance of a controller has a direct correlation with the performance of your site, in particular your page load time. Therefore, it’s important to make sure that controllers are tuned to give the best response time. The Technical Reports dashboard gives you insights about your site’s server-side technical operations data, including pipelines and controllers. To maximize the scalability and stability of your customization, particularly when the environment is under increased load, the critical storefront controllers should be at or below the average processing times suggested.
- Open Main Controller Requests > Technical tab, and sort by requests in descending order and show the controllers that have been requested the most. It is important to have such controllers tuned to the finest.
- Click into the controllers and view remote-includes controllers to understand where the time is most spent.
Page Cache and Performance
- An uncached request takes longer, as it must pass through multiple servers (web > application > database). Each layer amounts to more work, lengthening response time.
- A controller that uses fully cached templates optimizes the processing of requests, serving from cache right away and eliminating execution delay.
- The more templates that are cached, the faster the site loads and the less stress that is placed on the environment – increasing scalability.
Use the Technical tab to view the cache hit, cache miss, and cache miss and store of each controller. If you have poor cache hit ratio for certain controllers, review the caching strategy.
Gathering good data is the most helpful thing to do before contacting Support. Identify changes to your code or data to narrow down the possible causes of the problem:
-
Is the problem reproducible or intermittent?
-
If reproducible, what are the steps to reproduce?
-
Did any of the following happen right before the performance issues started:
- Replication of data or code:
- In Business Manager, click App Launcher and then select Administration> Replication> Data Replication
- In Business Manager, click App Launcher and then select Administration> Replication> Code Replication
- In Business Manager, click App Launcher
- Manual editing of data on the Production instance.
- Manual clearing of the cache or a cache partition on the Production instance.
- Import of a large data feed.
- Replication of data or code:
-
Capture HAR file while reproducing the issue.
-
Capture the DWSID to be shared in the support ticket.