Debug Using Chrome DevTools
To debug Lightning web components code, use Chrome DevTools.
Google Chrome includes a comprehensive suite of excellent web development tools, Chrome DevTools. These tools are great for debugging your Lightning web components.
To get started, load the simplest page possible that can run your Lightning component. Then open DevTools.
- On Windows and Linux, press Control-Shift-I in your Google Chrome browser.
- On Mac, press Option-Command-I.
- On any platform, press F12 or right-click in the page and select Inspect.
To quickly find which line of code is failing, in the Sources panel, enable the Pause on all exceptions option in the DevTools debugger panel before running your code.
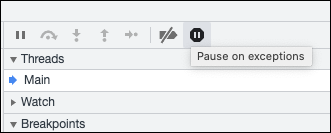
When you enable Pause on exceptions, the browser halts on exceptions that are caused by Salesforce code, other library code, and your component code. Exceptions thrown by your components can be caught in the framework code.
To learn more about debugging JavaScript on Google Chrome, refer to the Google Chrome DevTools website.
Check out Troubleshooting Lightning Web Components on Trailhead for step-by-step instructions using Chrome DevTools with Lightning web components.
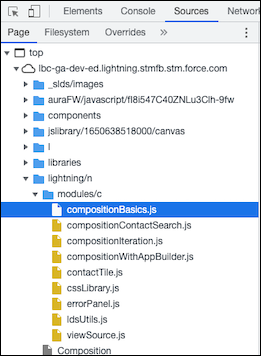
In the Sources panel of Chrome DevTools, find your Lightning web component code in the Page pane in the lightning/n/modules folder. Here you see components in the default c namespace folder.
For info about debugging with Lightning Web Security (LWS) enabled, see Debug with Lightning Web Security Enabled in Security for Lightning Components.
More debugging features are available when you enable custom formatters.
In Chrome DevTools, select Settings ( ) | Preferences | Console | Enable custom formatters.
The custom formatter for Lightning Web Components lets you see the real values contained in proxy objects. While you don’t see proxy objects while debugging, they’re still present and preventing modifications. The custom formatter enables visibility into the proxies without removing them.
If Lightning Web Security is enabled in the org, custom formatters also let you see additional messages and a filtered call stack in the DevTools console. See Debug with Lightning Web Security Enabled in Security for Lightning Components.
In debug mode, the Lightning Web Components engine identifies bad patterns that are only detectable during runtime, and prints them as console warnings.
It’s a best practice to develop your Lightning web components in an org using debug mode. You can improve your code while you develop by using feedback from the LWC engine.
One way to filter for only your own components is to remove the “info” log level to hide the stack traces.
See Also