Debug with Lightning Web Security Enabled
To debug Lightning components in an org where Lightning Web Security (LWS) is enabled, first enable debug mode. With debug mode, JavaScript code is easier to read because it isn’t optimized or minified. Debug mode also adds more detailed output for some warnings and errors.
To inspect your client-side code, we recommend using Chrome DevTools. To open DevTools on Windows and Linux, press Control-Shift-I in your Google Chrome browser. On Mac, press Option-Command-I.
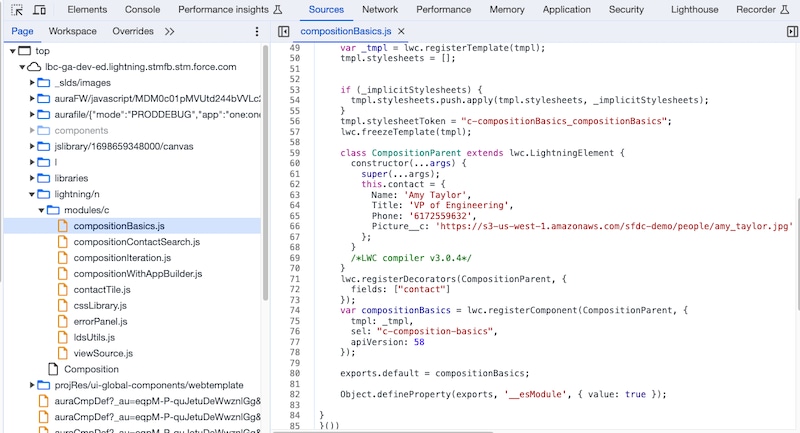
Beginning in Winter ’24, as you debug Lightning web components with Chrome DevTools, your component source code is displayed in the Sources panel inside the lightning/n/modules folder. This location is described in the Find Your Code in the Sources Panel section of the Lightning Web Components Developer Guide. The location is the same regardless of whether Lightning Locker or LWS is enabled.
Previously, when your Lightning web components ran in an org where Lightning Web Security was enabled, a special lws folder separately organized your component files under a namespace folder.

Here you see the c namespace and its components on the current page. The compositionBasics.js file with LWS enabled is shown with source mapping.
Source mapping enables the sandboxed code to appear similar to your components’ original source code. You can inspect it, use breakpoints, and so on. You must enable debug mode to see the source mapping and to enable breakpoints.
If the code in the Sources panel doesn’t look like your original source code, make sure the setting Enable JavaScript source maps in Chrome DevTools is enabled. It’s enabled by default.
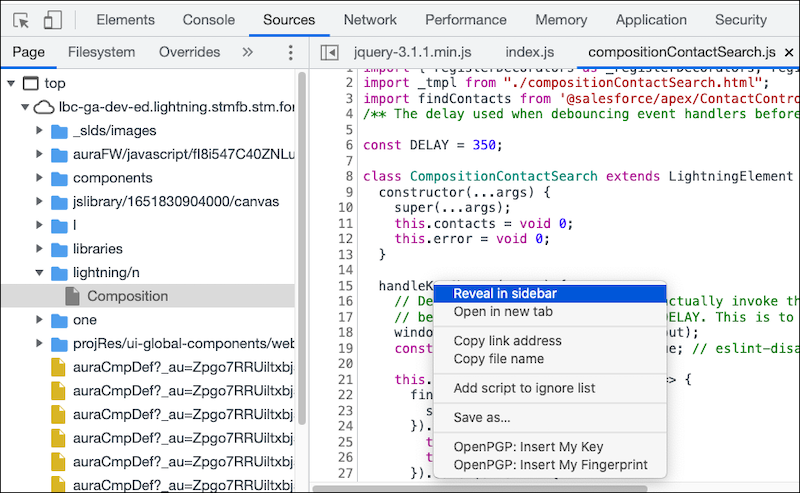
You can also find the source file in the Page pane when you’re already in the debugger. Right-click and select Reveal in sidebar.
Here the debugger stopped in compositionContactSearch.js, but the file is not selected in the sidebar. When you select Reveal in sidebar, the correct file is selected.

When you’re debugging Aura components, the source code is displayed in the Sources panel in the lightning/n/components subfolder inside a folder named for the org.
The lightning/n/components folder’s exact location can vary between browsers and sessions, and is also dependent on how you use the component. If you don’t see the folder right away, expand the nodes until you find it.
This example shows the Aura Interop component from lwc-recipes. The top folder name Aura_Interoperability matches the name of the Lightning page that contains the component. The highlighted file is used for debugging.

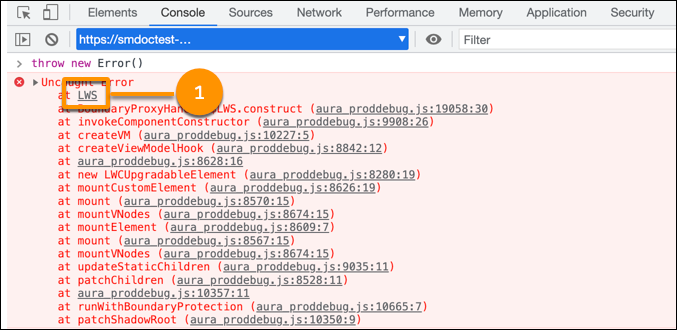
The stack trace in the Console filters out LWS calls to give you a clearer picture of errors in your components. The LWS calls are contained in their own folder (1).

To see filtered stack traces, enable custom formatters as described the Enable Custom Formatters section of the Lightning Web Components Developer Guide.
Console messages show information about LWS in console methods such as console.warn and console.info. For example, console.warn is called when an object mutation is tracked on one side of the sandbox and not the other.
To see LWS console messages, enable custom formatters as described in the Enable Custom Formatters section of the Lightning Web Components Developer Guide.
LWS changes the source code line number and source code file for console messages. Console messages appear to come from the Salesforce aura_proddebug.js file instead of from the component’s JavaScript file that logs the message. This behavior is a known issue that is due to browser implementations so we’re waiting for browser vendors to implement a fix.
See Also
- Limitations for Debugging with LWS Enabled
- Lightning Web Components Developer Guide: Debug Lightning Web Components
- Lightning Web Components Developer Guide: Debug Using Chrome DevTools
- Lightning Aura Components Developer Guide: Debugging