Debug Jest Tests for Lightning Web Components
VS Code provides tools to help you debug Jest tests efficiently. Use the Salesforce Extension Pack, Chrome DevTools, or the VS Code debugger advanced configuration, depending on your testing requirements.
Salesforce Extensions for Visual Studio Code provides an LWC Tests sidebar for you to run tests easily. You can run one test case, all the test cases in one file, or all the tests for your project. For more information, see the overview of capabilities in the LWC Tests sidebar..
To debug your test, add breakpoints in the test.
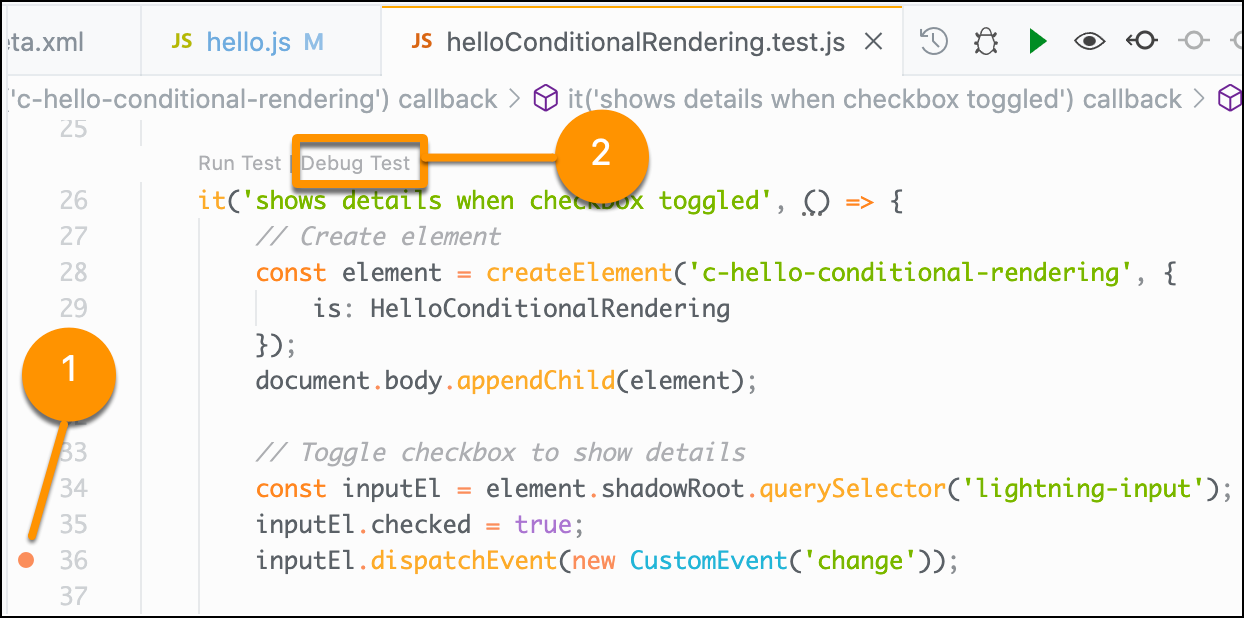
For example, if you want to make sure that an event is dispatched correctly, click the line number (1) that contains your dispatchEvent() method. You can also add a breakpoint on your event handler in the component’s JavaScript file to observe when the event handler is fired.
After adding breakpoints, click Debug Test (2). This link runs the command: node --inspect-brk node_modules/.bin/jest --runInBand.
See helloConditionalRendering.test.js in the lwc-recipes repository.
Display information related to running and debugging in the Run view.
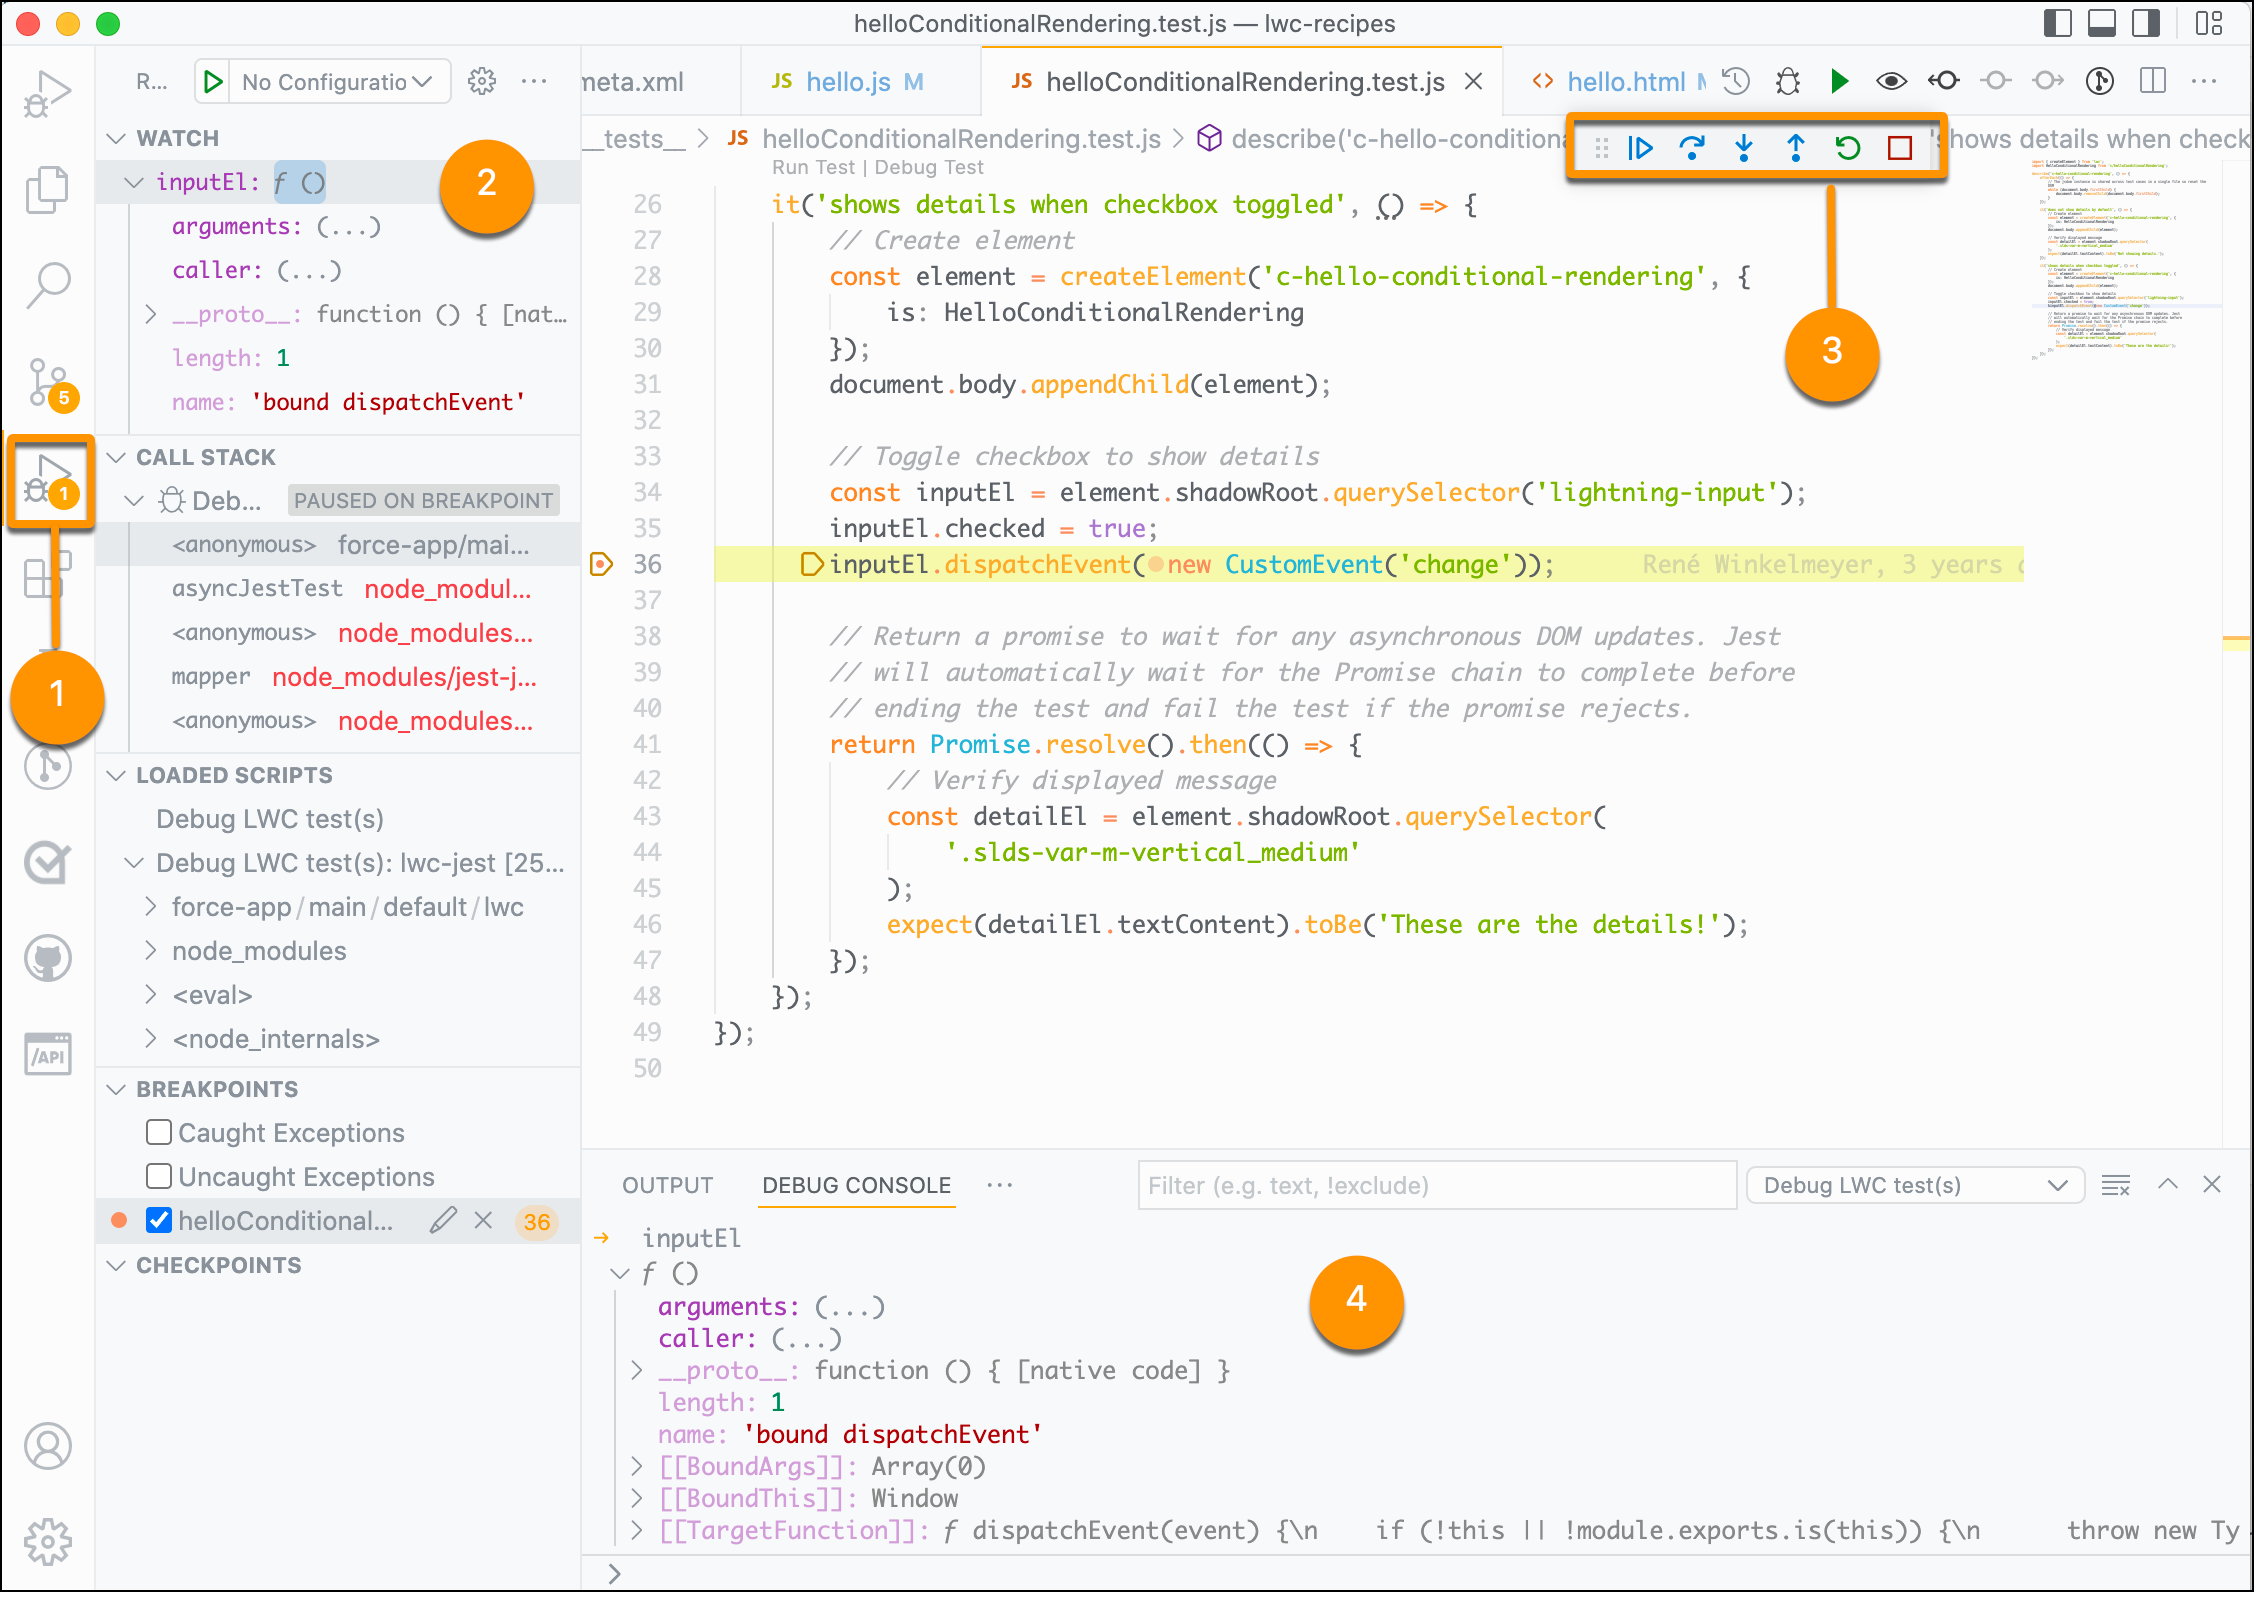
To open the Run view, click Run and Debug (1), where you can watch your expressions (2), and use the debug toolbar (3) to step through the test execution. In the Debug Console (4), you can inspect the element at the point of the test execution.
Click Continue on the debug toolbar (3) to step through your breakpoints. Your test finishes successfully if you don’t receive an error. View any test execution output in the VS Code terminal.
See Run, Debug or Watch Jest Tests from Within a File for more debugging techniques.
While the Salesforce Extension Pack enables you to debug your Jest tests from within VS Code, Chrome DevTools offers you comprehensive diagnostics features for web development.
To run all the tests in your project in debug mode, enter this command in the VS Code terminal.
This command calls sfdx-lwc-jest --debug, which then runs node --inspect-brk node_modules/.bin/jest --runInBand.
We recommend that you use the npm run test:unit:debug command since sfdx-lwc-jest is resolved as a node dependency and isn’t accessible on the command line.
To run a single test in debug mode, enter this command, where testName is the name of the test you want to debug.
Next, open a Chrome browser and go to chrome://inspect. The Remote Target section lists all the node processes running in your system in debug mode.
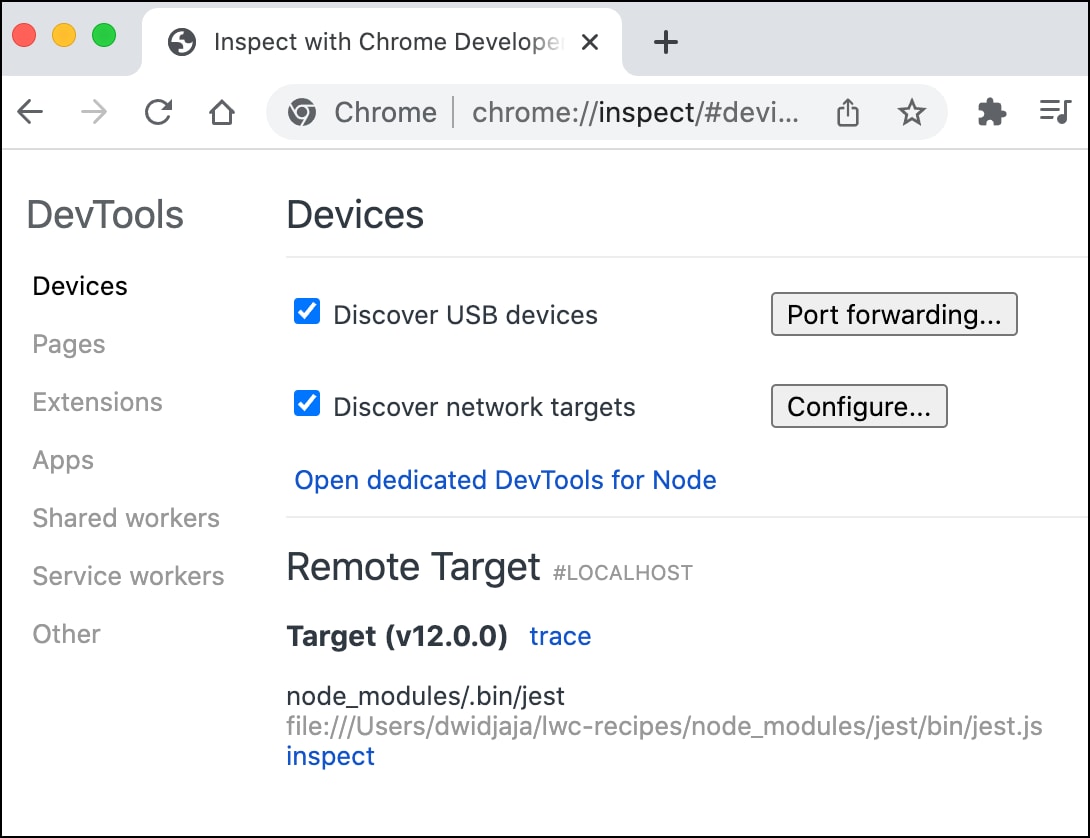
To open the DevTools window, click the inspect link under the Jest test listed in the Remote Target section.
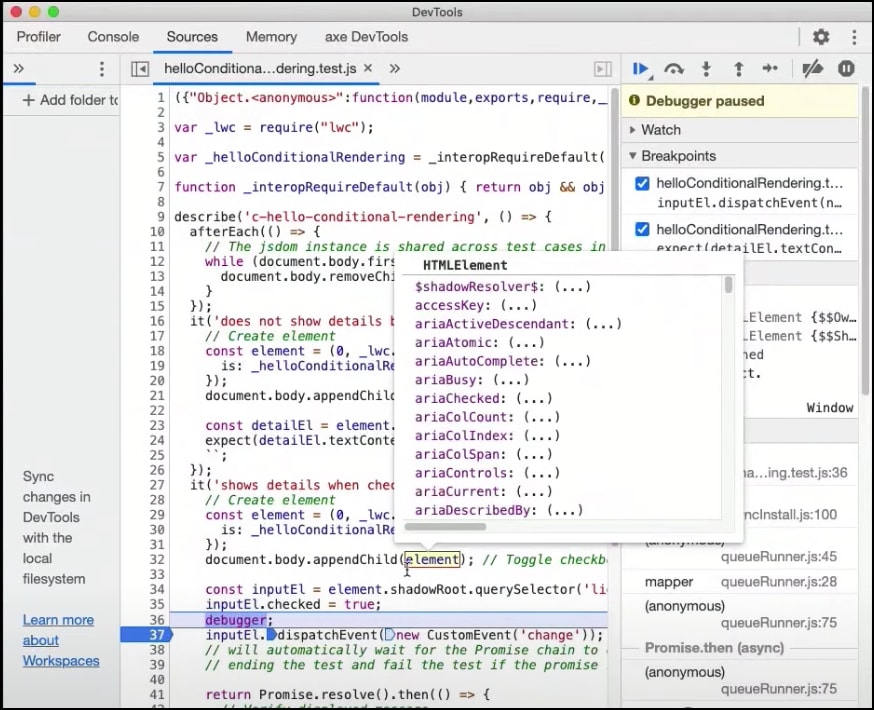
The DevTools Sources panel enables you to debug your tests. First, add a debugger statement in your test code in VS Code.
The Chrome inspector doesn’t step through the breakpoints you specify in VS Code in the previous section. Use the debugger statement in your test instead.
To resume test execution, click the Resume script execution ( ) button in DevTools. The test displays your test code and stops at the
 debugger statement you added, as shown on line 36 of the compiled code. You can then add breakpoints in the Sources panel, as shown on line 37 in this screenshot.
See Debug JavaScript for more debugging techniques using Chrome DevTools.
If you require more control on how to run your Jest tests in debug mode, consider using the VS Code advanced configuration.