Preview and Debug an Agent
As you develop your agent, it’s helpful to periodically converse with it to see how it responds to your statements, questions, and commands (utterances). These conversation previews serve as interactive tests to make sure that the agent is behaving as expected.
When you preview an agent conversation, you get the behind-the-scenes details of how your agent is working, so it’s easier to identify unexpected behavior and improve your agent. You can view interaction details for the current and past messages, which give you a high-level overview of your agent’s reasoning, accompanied by AI-generated explanations.
For example, you can check if the agent correctly uses a specific subagent when asked a question. And then check if it invokes the appropriate action associated with that subagent. You use natural language in these conversations, mimicking how your customers interact with the agent after you publish and activate it.
Agent preview using either VS Code or a CLI command doesn’t provide strict adherence to connection endpoint configuration. Agent preview also doesn’t support escalation. To test escalation, first publish your agent and then test it using the desired connection endpoint, such as a Web Page, SMS, and so on.
You can interactively preview an agent while coding its Agent Script file in your local DX project, or you can preview an activated published agent that’s in your org. You also have two tools to choose from when previewing: the Agent Tracer tab in VS Code’s Agentforce DX panel or the agent preview CLI command.
When previewing an agent from its Agent Script file, you can use these two modes:
- Simulated mode - Uses only the Agent Script file to converse, and it simulates (or mocks) all the actions so there’s no risk to the data in your org. This mode is useful if the Apex classes, flows, or prompt templates that implement the actions aren’t yet available. The LLM uses the information that you’ve added about the subagents in the Agent Script file to simulate what the action does or how it responds.
- Live mode - Uses the actual Apex classes, flows, prompt templates, and users in your development org to get the most accurate view of your agent’s performance. Because this is a live preview, if you’ve changed the Apex classes, flows, or prompt templates in your local DX project, then you must deploy them to your development org for the live preview to use them. Otherwise, the live preview uses what it finds in the org. You must also set the
default_agent_userproperty in the Agent Script file to an actual user in your org. You can use the Apex Replay Debugger to debug your Apex classes when using live mode.
When you preview an activated published agent, you always use actual Apex classes, flows, prompt templates, and so on.
The preview functionality described so far is interactive: you, the human, having a conversation with your agent. Agentforce DX also provides a set of agent preview CLI commands for previewing an agent programmatically, which other agents can use to preview your agent. Crazy times.
As you converse in VS Code, you can simultaneously inspect the exact JSON messages that are sent back and forth between the preview and the org. This information helps you understand exactly how your agent processes each conversation. The messages provide a detailed, step-by-step view of the agent’s decision-making process, including:
- How the agent interprets user utterances.
- Which actions the agent selects and why.
- API calls and data transformations.
- Response generation and output formatting.
Use this tracer functionality to troubleshoot unexpected behavior, optimize agent performance, and gain insights into your agent’s reasoning.
You can also download the response and tracer JSON files after a preview session ends.
Use the integrated Agent Preview pane in VS code to have an interactive conversation preview with your agent.
-
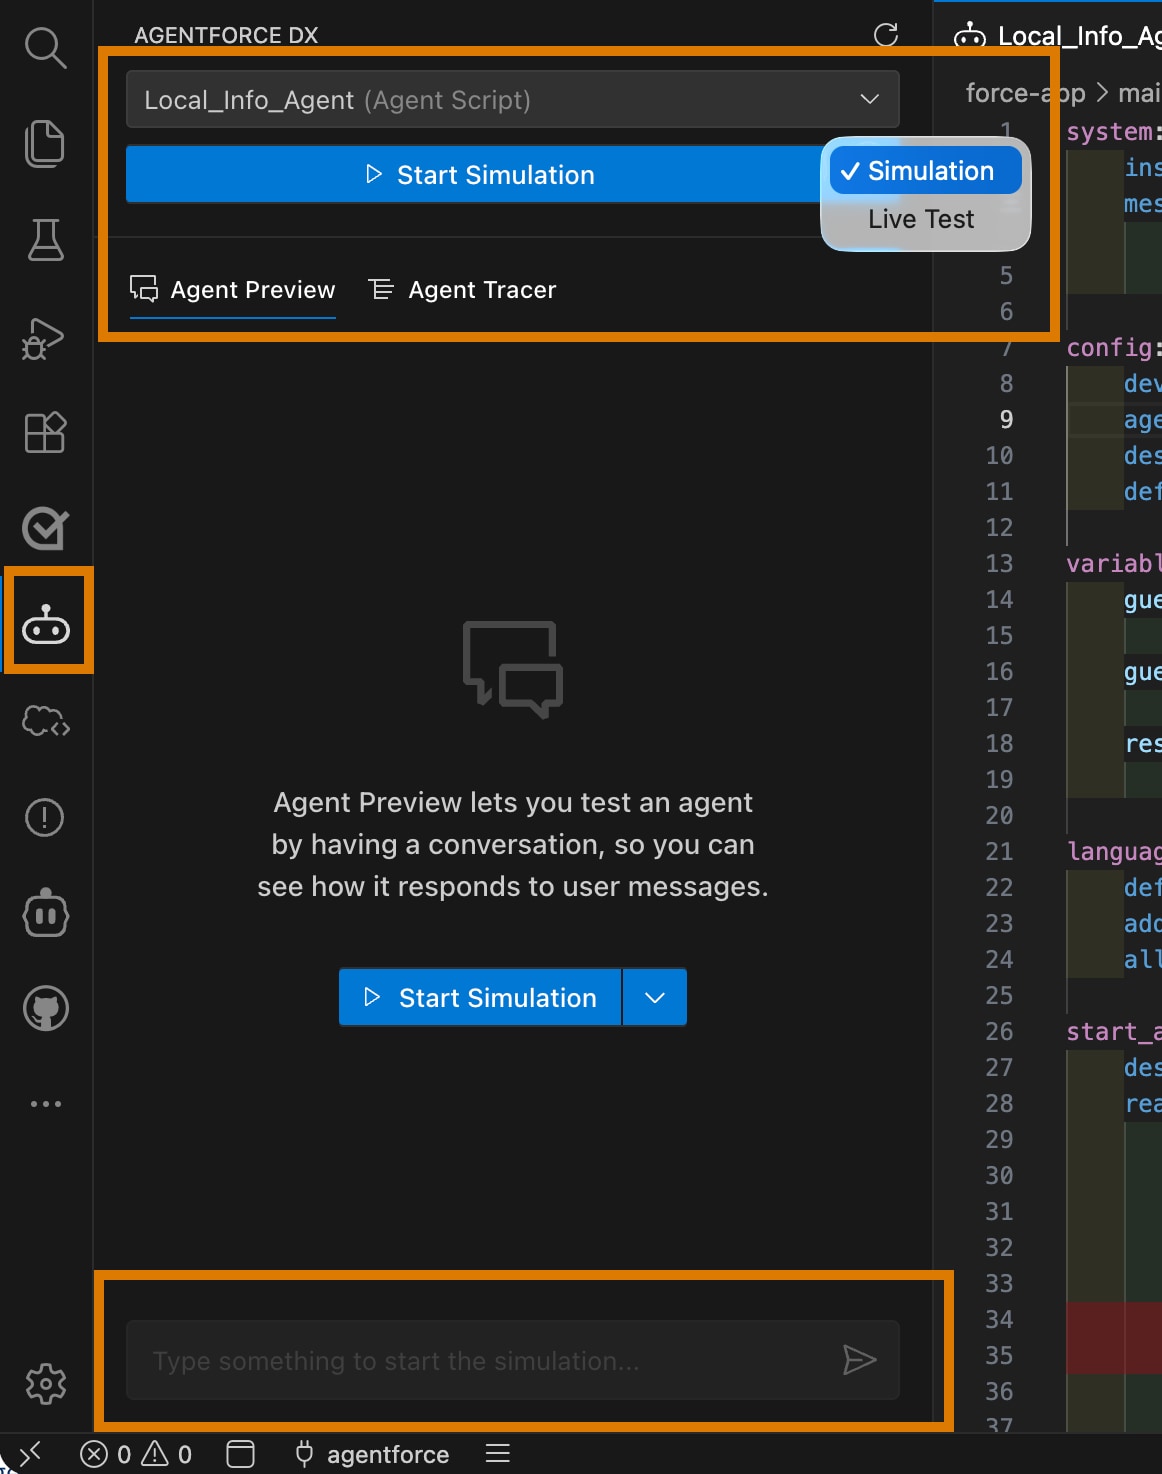
In VS Code, in the Activity bar, open the Agentforce DX panel by clicking the Agentforce DX icon (
 ) in the Activity Bar.
 -
From the Select agent… drop-down list, select the agent you want to preview.
The list of agents is split into two sections:
- Agents that have a local Agent Script file inside of an authoring bundle (
Agent Script) - Agents that are published in the org (
Published).
- Agents that have a local Agent Script file inside of an authoring bundle (
-
If you’re previewing a published agent, click Start Live Test. VS Code loads the agent and activates the chat window at the bottom of the panel.
If you’re previewing an Agent Script agent, in the drop-down, select whether you want to run a Simulation or Live Test. After you pick one, the blue button changes in response, so you then click either Start Simulation or Start Live Test to actually start the preview.
If you have an Agent Script file open in the editor, you can also right-click it and select AFDX: Preview this Agent to go directly to the correct preview pane.
VS Code validates and compiles the Agent Script file, then activates the chat window at the bottom of the panel.
-
In the chat window, start chatting with your agent by entering a statement, question, or command. The agent responds, using the Agent Script file as its blueprint for what to say or do.
-
If you’re using live mode (with either Agent Script or published agents), you can also use the Apex Reply Debugger to debug issues with Apex classes. Enable Debug Mode by clicking Start Debug Mode.

To invoke the Apex Reply Debugger, set a breakpoint in the Apex class you want to debug. Then start chatting again. As soon as an agent action invokes that Apex class, the Apex Replay Debugger automatically starts, and you can debug as usual. See Apex Replay Debugger for details.
-
If you’re previewing an agent using its Agent Script file, select the Agent Tracer tab to see the actual JSON messages that were sent back and forth between VS Code and your org during your chat session.
The panel lists all the recent messages. Click the Open JSON icon to the right of a particular message to see the full JSON trace file for that message. Open the message to see basic info, such as its session ID, plan ID, and timestamp, and then a clickable list of all the subsections of the JSON response, such as
Session Initialize,Variable Update, orReasoning. -
Click the Save Chat History icon at the top of the Agentforce DX panel to download the response and trace files.
If you edit the Agent Script file during preview, you must validate the file and then compile and restart the simulated or live preview to test the changes.
Start an interactive preview conversation with your agent with the agent preview Salesforce CLI command.
-
In VS Code’s integrated terminal or a separate terminal or command prompt, run the
agent previewCLI command.The command displays a list of agents, use the arrow keys to select the one you want to preview. The list shows whether the agent has a local Agent Script file (
Agent Script) or whether it’s a published agent (Published).By default, the preview runs in simulated (mocked) mode if you’re previewing using the Agent Script file. To preview the agent in live mode, specify the
--use-live-actionsflag. You can also specify a directory in which to save the response and transcript files with the--output-dirflag. Specify the--apex-debugflag to optionally generate Apex debug log files in the output directory. For example:You can optionally use the
--authoring-bundleflag if you know the API name of the authoring bundle that contains the Agent Script file. -
At the
Start typing...prompt, enter a statement, question, or command, then press Return. Your utterance displays on the right along with a timestamp. The agent then responds on the left.It takes a few moments for the CLI command to start the session. You can start typing when you see New session started and a session ID.
-
To exit the conversation, press ESC or Control+C. Before exiting, the command asks if you want to save the response and transcript files, and where to save them.
If you specified the --apex-debug flag, and a conversation message executes Apex code, then an Apex debug log file is written in the specified output directory. See Debug Apex Code in the Salesforce Extensions for Visual Studio Code guide for information about using these debug log files with the Apex Replay Debugger.
The previous sections show how to interactively preview an agent, either in VS Code or with a CLI command. But let’s say you’re vibe coding away, and you want the vibe-coding agent to be able to preview your agent. In this case, the vibe-coding agent needs a programmatic way to preview your agent. So it can use the four agent preview <command> commands to start a preview session, send a message, list the sessions, and end a session.
While agents typically use these CLI commands, you can use them if you want! Let’s see how they work.
These commands require that you specify the agent you want to preview programmatically with flags. You have the usual two options:
- To preview an agent using its Agent Script file, specify the associated authoring bundle’s API name with the
--authoring-bundleflag. The API name of an authoring bundle is the same as its directory name under the “aiAuthoringBundles” metadata directory in your DX project’s package directory. - To preview an activated published agent, specify its API name with the
--api-nameflag. The API name of a published agent is the same as its directory name under the “Bots” metadata directory in your DX project’s package directory.
Use the --target-org flag to specify the username or alias of your development org; the flag isn’t required if you set it as your default org.
-
In VS Code’s integrated terminal or a separate terminal or command prompt, run the
agent preview startCLI command to start a programmatic agent preview session. Use either--authoring-bundleor--api-nameto identify the agent you want to preview.The command displays the session ID of the new preview session. If you’re previewing using a local Agent Script file, then the agent responses are simulated (mocked). To use real Apex classes, flows, and so on in the org, specify the
--use-live-actionsflag. -
Send a message (utterance) to the agent using the
agent preview sendcommand. Use the--utteranceflag to send the message, wrapped in double quotes. Use the--session-idflag to specify the session ID, although it’s not required if the agent has only one active session. You must also specify either--authoring-bundleor--api-name.The command displays the agent’s response.
-
Run the command
agent preview sessionsto view all the known session IDs. The table displays the associated API name. -
End the session by running the
agent preview endcommand.The command displays the local directory where the session trace files are stored.
When using the agent preview CLI commands or Agent Tracer panel in VS Code, you can opt to save a record of the conversation. If you opt in, the command creates a directory, using the session ID as the name, in the specified output directory. It then creates these files.
-
transcript.json: A record of the conversation between you and the agent. The conversation messages have properties that provide thetimestampandsessionID, the agent’s API name (agentID), therole(eitheruseroragent), and the message content in thetextproperty. -
traces/<sessionID>.json: The full list of API messages from the agent in response to your utterances. Each message contains many additional details, such as the type of response, the intent and invoked subagent, the execution plan, the sent tools, the actual messages, and much more.The Agentforce DX preview functionality uses the Agent API internally. For more details about the API responses, see the documentation and reference.