Connect to a Published Agent
After you've published and activated your agent, you can connect and chat with it as if you were one of your customers. It's another type of test. For example, you can check if the agent correctly uses a specific topic when asked a question. And then check if it invokes the appropriate action associated with that topic. You use natural language in these conversations, simulating how your customers interact with the agent after it's deployed.
There are two ways to connect to a published agent:
Before you can connect to a published agent with either a CLI command or in the VS Code Agent Preview pane, you must complete these steps.
-
In the development org that contains the published agent you want to connect to, create a connected app as described in Create a Connected App. As you go through that task, also complete these additional steps:
-
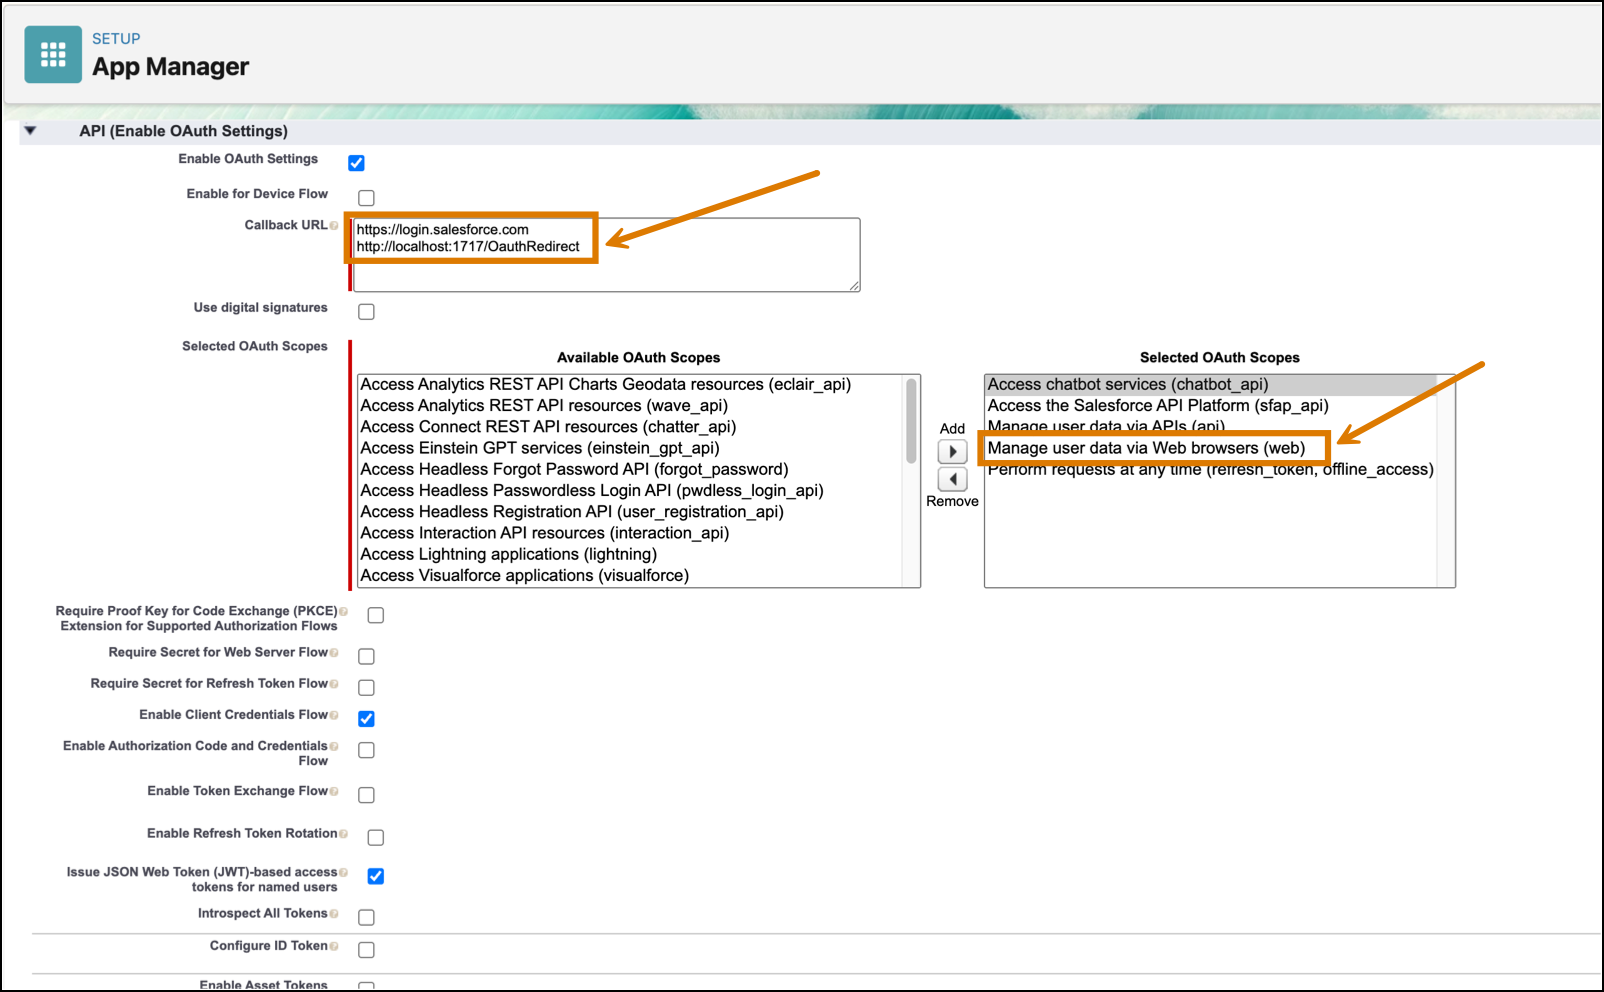
When specifying the connected app's Callback URL, also add this second callback URL on a new line:
http://localhost:1717/OauthRedirect. -
When adding the scopes to the connected app, also add
Manage user data via Web browsers (web).
This screenshot highlights the additional required connected app settings:
-
-
Add the connected app to your agent as described in Add Connected App to Agent.
-
Copy your new connected app's consumer key (sometimes called client id) as described in Obtain Credentials.
-
In VS Code's integrated terminal, run the
org login webCLI command to authorize the development org that contains the agent you want to connect to.If you're already working with the development org on your computer, you probably already completed this step. For the purposes of this document, assume the username you used to log in to the org is
jdoe@example.com. -
Link the new connected app (that you previously created) to your authenticated user by running the
org login webCLI command again, but with flags that specify the required information to create the link. For example:Here's what these flags mean:
- The
--client-appflag gives the link to the connected app a name; you can specify any string you want. You use this name later when you actually connect to the agent. - The
--usernameflag specifies the authenticated user for the org, or the one you authorized with the firstorg login webcommand. - The
--client-idflag specifies the connected app's consumer key that you copied in a previous step. - The
--scopesflag specifies the OAuth scopes that theagent previewcommand requires; these are the short names for the scopes that you already configured for the new connected app.
- Press Enter to skip sharing the client secret.
- In the browser that opens, log in to your development org using your org's username (such as
jdoe@example.com). - Click Allow. When you see the Authentication Successful message, you can close the browser window.
- The
Connect to your published agent using the integrated Agent Preview pane. To connect to a published agent, it must be active.
- Complete the prerequisites in the org that contains your agent.
- In VS Code, in the Activity Bar, click the Agentforce DX icon. The Agent Preview pane opens.
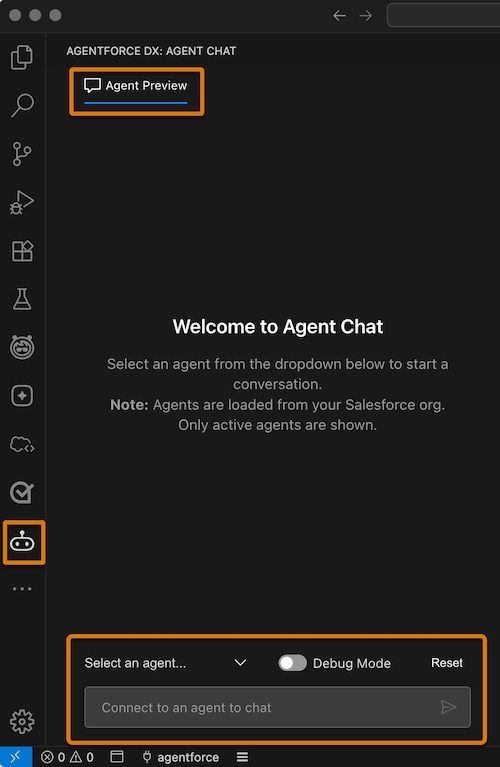
- In the Select an agent.. drop-down, select the agent you want to converse with. Only active agents are listed.
- If you want to use the Apex Reply Debugger to debug issues with Apex classes, enable Debug Mode.
- In the chat window, start chatting with your agent by entering a statement, question, or command.
- To invoke the Apex Reply Debugger, set a breakpoint in the Apex class you want to debug. Then start chatting again. As soon as an agent action invokes that Apex class, the Apex Replay Debugger automatically starts, and you can debug as usual. See Apex Replay Debugger for details.
This feature is a pilot or beta service that is subject to the Beta Services Terms at Agreements - Salesforce.com or a written Unified Pilot Agreement if executed by Customer, and applicable terms in the Product Terms Directory. Use of this pilot or beta service is at the Customer's sole discretion."
Connect to your published agent by running the agent preview Salesforce CLI command in VS Code. To connect to a published agent, it must be active.
-
Complete the prerequisites in the org that contains your agent.
-
In VS Code's integrated terminal, run the
agent previewCLI command. Use the--client-appflag to specify the name of the link that you previously created to the connected app; in our example we called the linkagent-app. Use the--target-orgflag to specify the username or alias of your development org as usual.For example, to connect to an agent in the org with alias
my-organd link to the new connected app using the nameagent-app, run this command:The command first displays a list of active agents in the org; use the arrow keys to choose the one you want to connect to and press Return. The command then asks if you want to save the agent's responses and a transcript of the conversation, and in which directory to save them. You can also specify a directory when you run the command with the
--output-dirflag. Specify the--apex-debugflag to optionally generate Apex debug log files in the output directory:To find the name of the link to your connected app to pass to the
--client-appflag, runorg displayon your development org and see the Client Apps entry. -
At the
Start typing...prompt, enter a statement, question, or command, then press Return. Your utterance displays on the right along with a timestamp. The agent then responds on the left. -
To exit the conversation, hit ESC or Control+C.
If you specified the --apex-debug flag, and a conversation message executes Apex code, then an Apex debug log file is written in the specified output directory. See Debug Apex Code in the Salesforce Extensions for Visual Studio Code guide for information about using these debug log files with the Apex Replay Debugger.
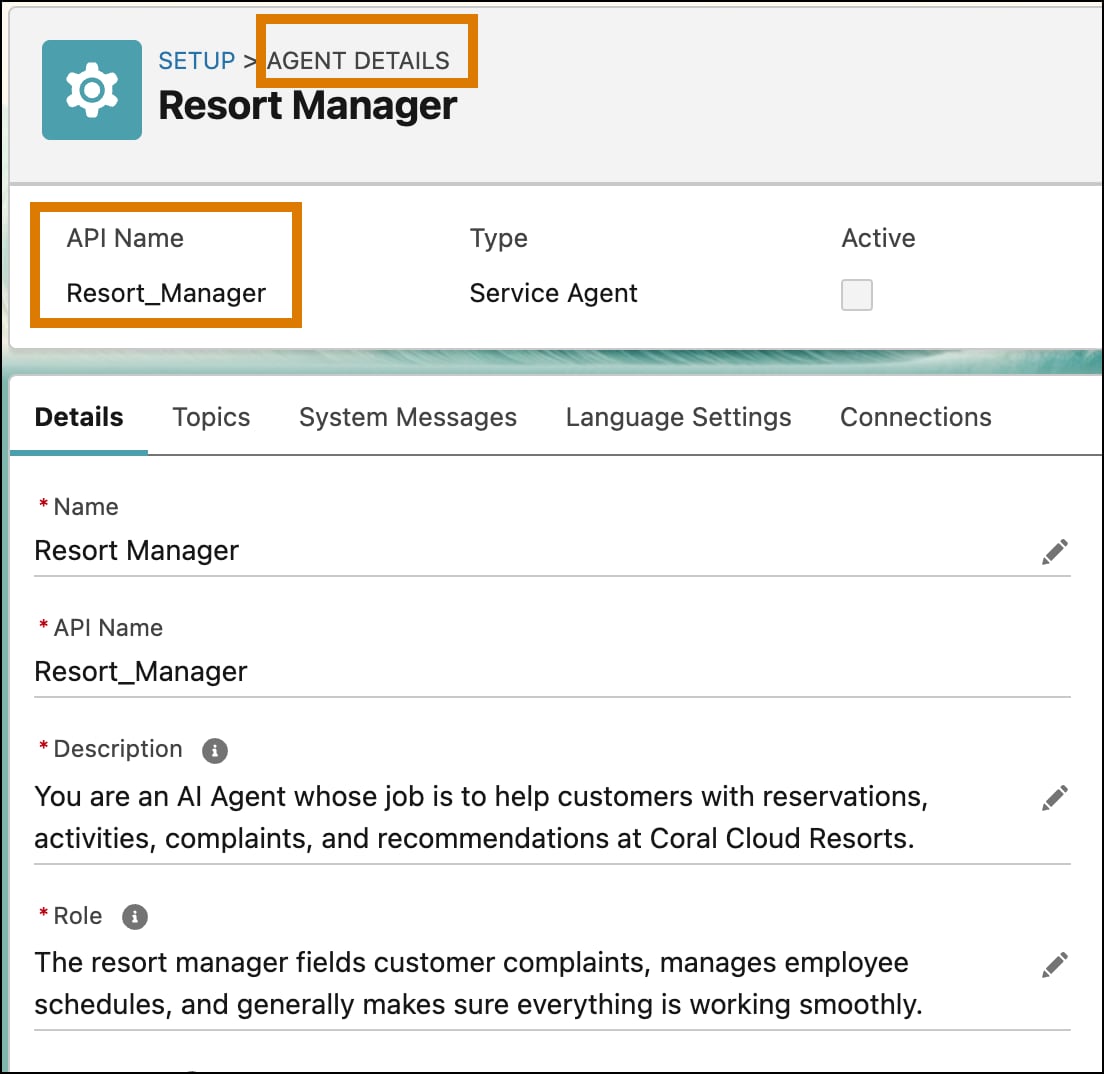
You can optionally use the --api-name flag if you know the API name of an active agent; the CLI command doesn't then ask you to choose an agent to connect to. Find your agent's API name in its Agent Details page of your org's Agentforce Builder UI in Setup.
If you opt to save a record of a conversation with an agent, the agent preview command creates a directory with a timestamped name in the specified output directory in your DX project. It then creates these files.
-
transcript.json: A record of the conversation between you and the agent. Each message in the conversation has three properties: the role (either you theuseror the API name of the agent), the content (either your utterance or the agent's response), and a timestamp. For example: -
response.json: The full list of API messages from the agent in response to your utterances. Each message contains additional details, such as the type of response, its internal ID, and more. Here's the full API response from preceding conversation message example:The
agent previewcommand uses the Agent API internally. For more details about the API responses, see the documentation and reference. For example, the InformMessage reference page provides more information about some of the JSON properties in theresponse.jsonfile.