Debug Mode
In debug mode, JavaScript code is easier to read and debug. The JavaScript source you see in DevTools looks similar to your uncompiled source code. Debug mode also adds more detailed output for some warnings and errors.
Component code is compiled in both production mode and debug mode. In debug mode, the compiled JavaScript code isn’t optimized or minified. The LWC compiler can generate information that enables more advanced debugging features.
After your user account is enabled for debug mode, you see these changes.
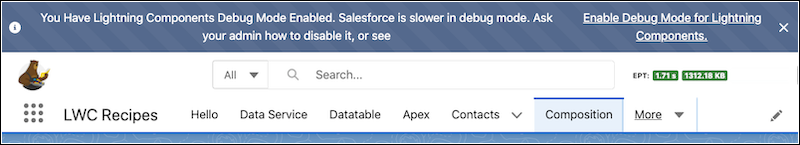
- A banner appears at the top to remind you that debug mode is on and that it slows things down.
- An Experienced Page Time (EPT) metric appears in the page header. It’s presented in green, orange, or red to indicate the health of the page’s load time.
- A storage metric in the page header shows kilobytes of data stored by the page to indicate memory usage and caching. The metric is similarly color-coded with green, orange, or red.
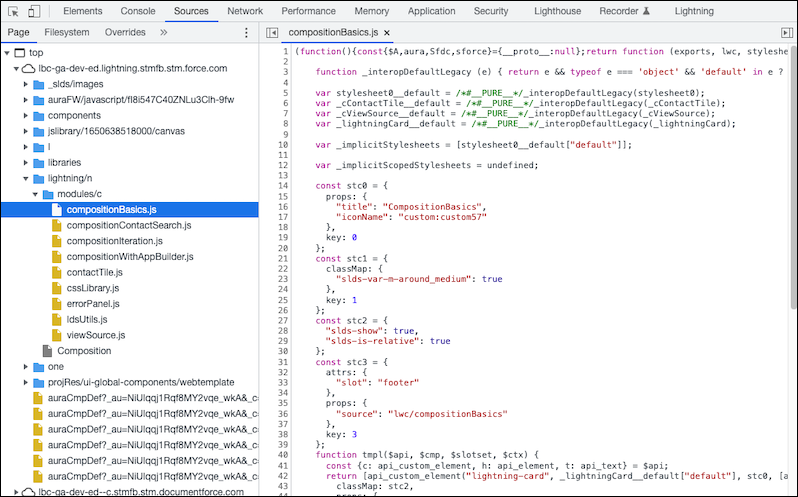
The same lwc-recipes sample code we looked at in production mode with pretty print looks less cryptic when unminified with debug mode enabled. It’s more readable and shows names of functions and variables.
See Also