Debug Wire Adapters
Use debug mode to troubleshoot your wire adapters with unminified JavaScript and custom formatting.
The easiest way to debug your wire adapters is via Chrome DevTools.
To debug a wire adapter:
When you receive data via an @wire, your data is bound to a function or a property.
If you use a wired function, you can debug based on the deconstructed data and error properties in the Sources panel of Chrome DevTools.
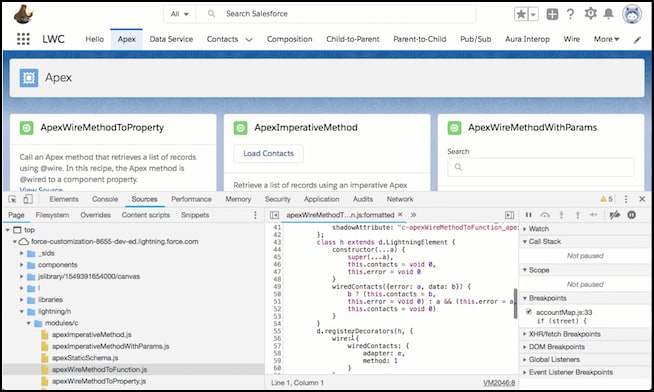
Alternatively, you can debug a wired function using the method described in the next section.
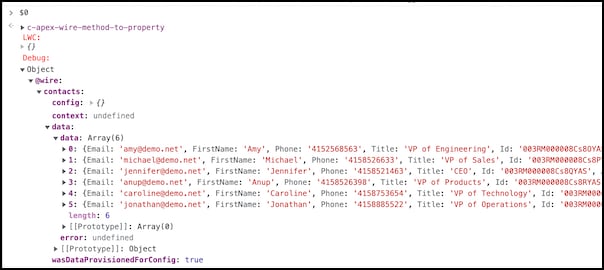
If you use a wired property or method on a component, debug information is available via the custom object formatter.
Each wired property or method returns information with the following shape:
data—The last value returned by the wire adapterconfig—The last config reported to the wire adaptercontext—Only for context wire adaptersisDataProvisionedForConfig—A boolean that returns whether or not the data provisioned by the wire adapter corresponds to the config. If a config was reported, it returnstrue.
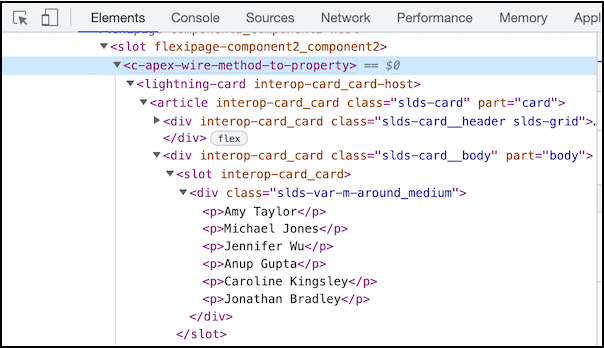
The lwc-recipes repo has an apexWireMethodToProperty component that uses a wired property.
Inspect a component instance using this or inspect a rendered LWC custom element. For example, click the <c-apex-wire-method-to-property> element in the Elements panel of Chrome DevTools.
After you click on the element, open the Console panel and enter $0 to return the debug information.
An undefined reactive parameter prevents the wire from firing, so both data and error stay undefined. Confirm that every $-prefixed config value has an initial value on the class. See Wire Service Syntax.
See Also