Navigate the Web Console User Interface
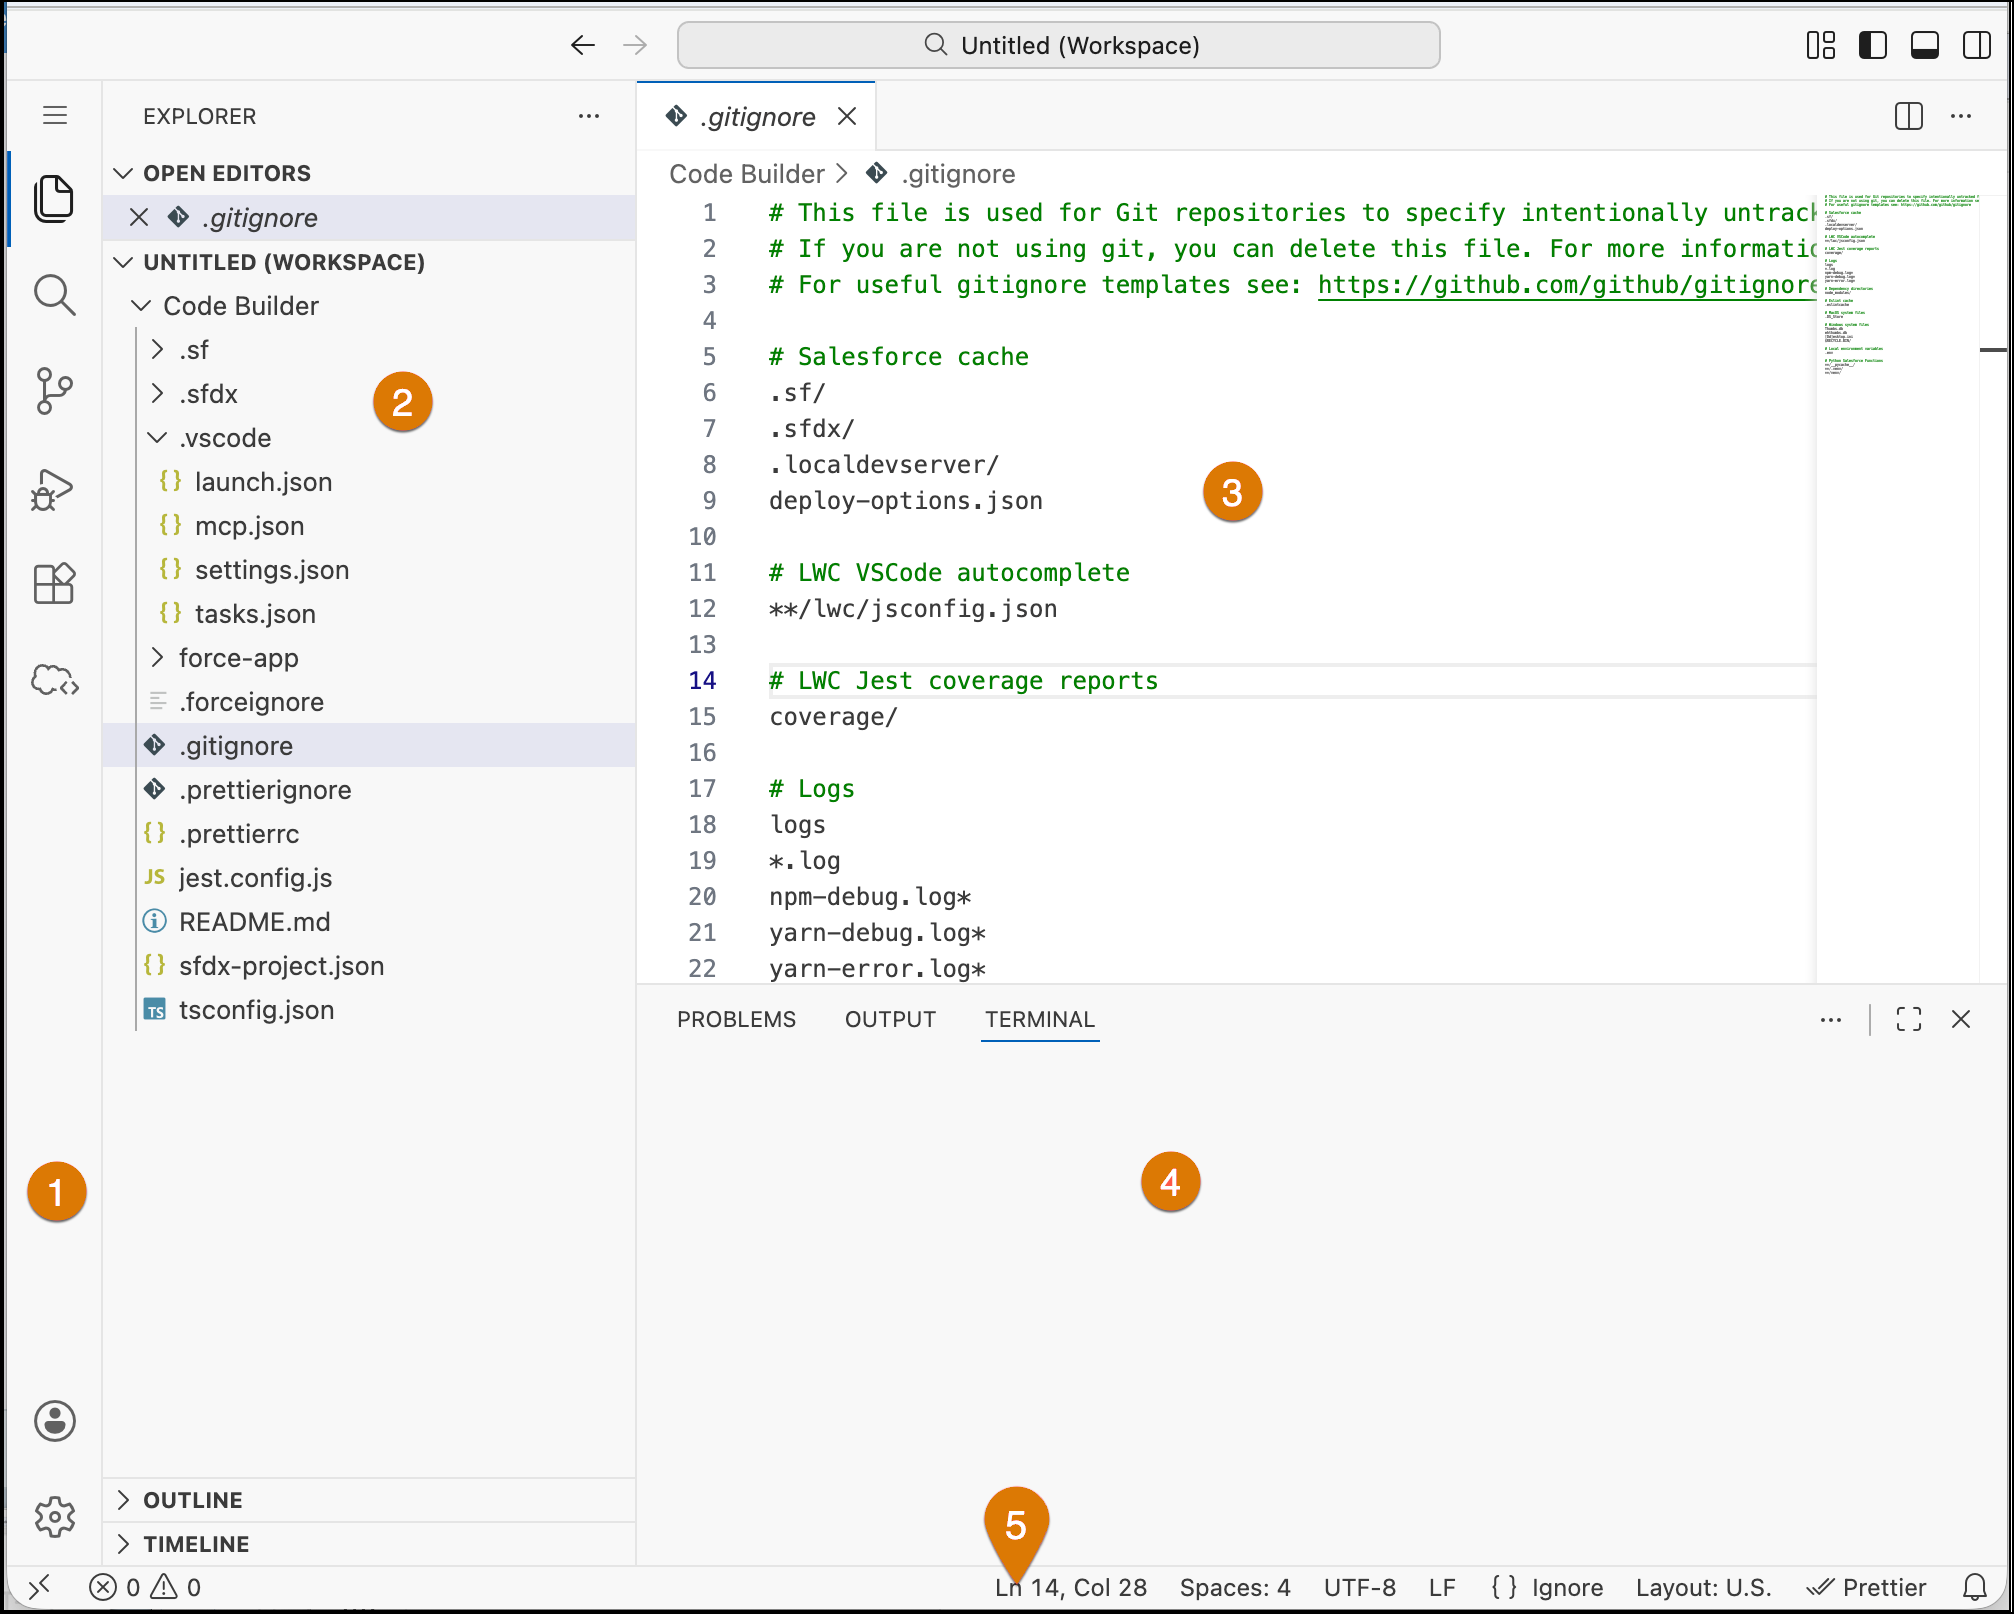
The Web Console user interface is divided into these five main areas.
-
Activity Bar: Contains icons to switch between different views. In our example, the Explorer view is active. These are the different views listed on the bar.
The extensions in Web Console come prepackaged. You can’t install or search for an extension on the Visual Studio MarketPlace. Hence, the extensions view is blank. To see a list of installed extensions, click the ellipsis (…) on the Extensions Installed panel on the left side, and select Show Running Extensions.
- Explorer
- Search: Enables you to search and replace a text across the project
- Run and Debug: Enables you to run and debug your code
- Org Browser
-
Sidebar: Contains different views to assist you while working on your project. For example, you can see the Explorer view in our example. It lists the files in a DX project structure.
-
Editors: Contains main areas to edit your files. You can open as many editors as you like side by side, vertically and horizontally.
-
Output Panel: Shows output, terminal, and debug information in different tabs. To view a detail, select the appropriate tab.
-
Status Bar: Shows information about the current project and the files that you’re editing. This bar also shows the tracing status, if enabled.