Apex debug logs contain a wealth of information. They cover such things as database operations, system processes, code executing in managed packages, errors that occur when executing a transaction, and flows and process builders that have started. All of this information is a huge help when trying to address a performance problem, diagnose bugs, or just understand what is happening in the code when you kick off a process. However, it is really hard to keep track of what is happening from the raw log on its own.
The Apex Log Analyzer shows the debug log details in a flame graph view on the Timeline tab, which is an excellent way to help visualize the call tree and duration of each method or statement, as well as see where managed packages and flows fit in. The tool allows you to quickly pin down which areas of code are taking the most execution time, and identify problem areas.
Along with the Timeline tab, the Apex Log Analyzer contains three other tabs with helpful information:
- Call Tree tab – displays method calls
- Analysis tab — a summary of method performance
- Database tab — a breakdown of the DML and SOQL queries contained in the log

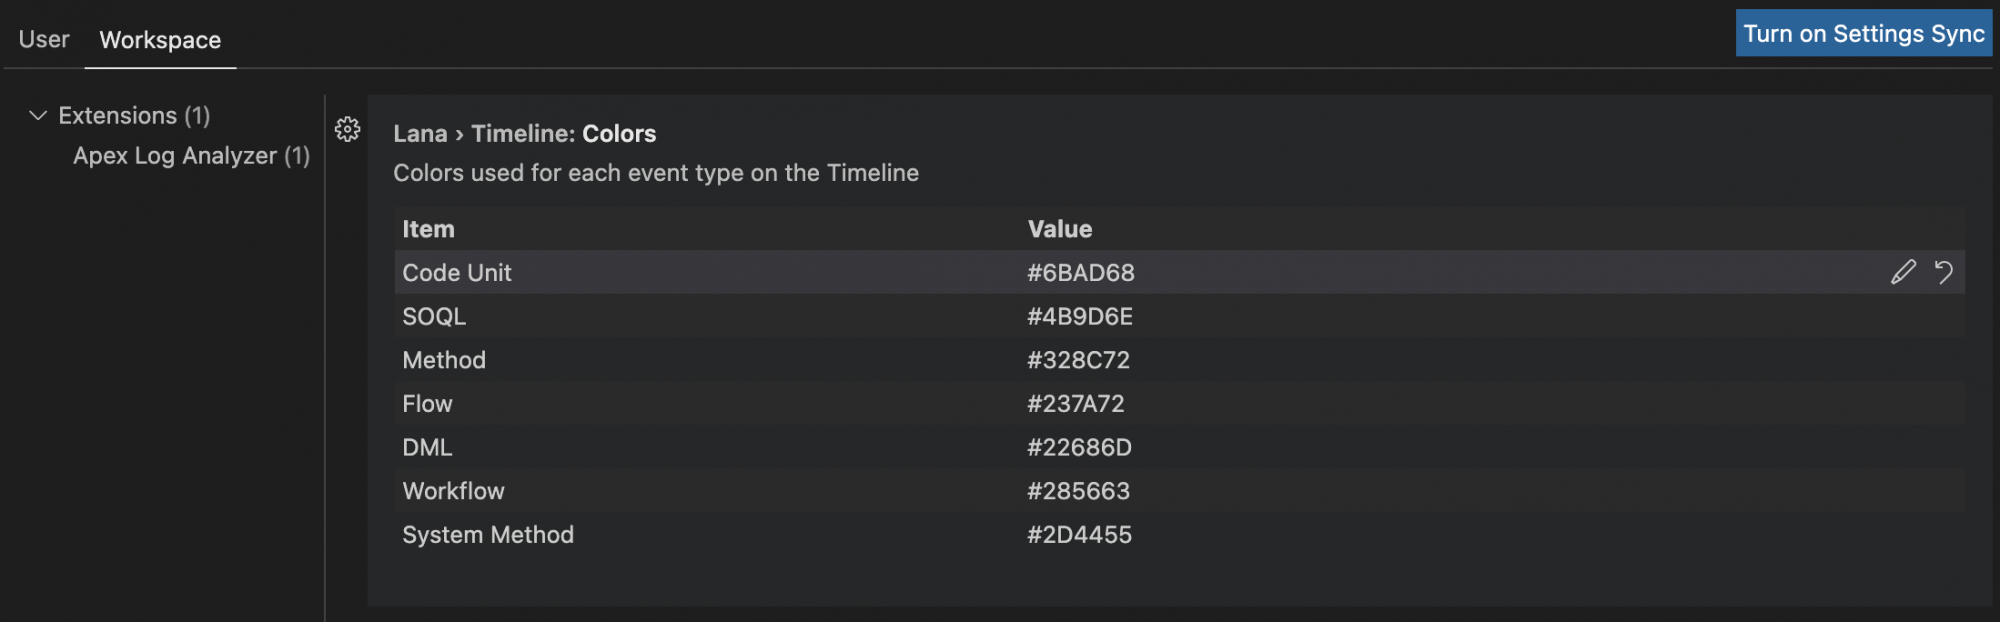
The tool allows you to pick your own colors. Just go to the settings UI within the IDE and search for “Apex Log Analyzer Colors.”
What’s new in v1.5.0
We have been working hard to improve the Apex Log Analyzer with new features requested by the community and developers from FinancialForce. Here’s what we added for v1.5.0.
Get a close-up
Some of those method calls can be really small, and it can be hard to see what is going on in those really busy areas of the timeline. So, we added an option to zoom in — with an accuracy of 0.001ms! You can zoom in and out using the mouse on a specific location on the timeline and scroll up and down. You can also scroll left and right, as well as drag the timeline by clicking and dragging the mouse up, down, left, and right.
More speed and event types
We know that some of those logs can get pretty large, and no one likes to wait around too long. So, now the log viewer will open, parse the log, and show the timeline faster.
We spent time with the debug logs documentation and lots of debug logs, and we’ve added support for as many as we could find. If you spot any we missed or that don’t work quite right, let us know by opening an issue on our GitHub repository.
Database navigation
The Database tab always showed all the SOQL and DML that occurred, but now we have included the call tree for each query as well. You can speed up dealing with a query that is including more rows than you expected by clicking through to the line in the class where the SOQL occurred, assuming you have the code locally.
Conclusion
If you have not yet tried the Apex Log Analyzer tool, then go download it from the Visual Studio Marketplace. This is an essential tool when working with debug logs. If you run into an issue or want to see a new feature, come on over to the GitHub repo – you could even contribute yourself!
About the author
Luke Cotter is a Senior Software Engineer at FinancialForce. He has worked closely with the IDE Experience team at Salesforce (PM Ananya Jha & co) on the Salesforce Log Analyzer Extension — part of the Salesforce Extension Pack.