Whether you are a new developer just starting your career in the Salesforce ecosystem, or an experienced Salesforce Developer who hasn’t yet switched to our new developer tools, this blog post series is for you. We’ll show you how to set up and use the tools that can help every Salesforce Developer to become much more productive and happy.
In Part 1 of this series, we discussed how to obtain a free org for development and how to install the developer tools that every Salesforce Developer should be using today. We showed you how to create a project and authorize it with your org, and finally, how to deploy metadata using the Salesforce CLI or VS Code. In this second blog post, you’ll learn how to retrieve metadata, work with source-tracked orgs, and use Node libraries to look after the quality of your code. Additionally, we’ll share other hidden gems from the Salesforce extensions for VS Code. Let’s dive into it!
Retrieving metadata from the org
One pillar of Salesforce development is to be efficient by not reinventing the wheel. That’s why there are many low-code tools available that allow you to create and modify metadata directly in your org with just clicks. You may see these tools referenced as “point-and-click” tools or “declarative” tools. Some typical metadata that you create with clicks are pages, apps, and flows.
This metadata is something that you can retrieve in your local project and continue to extend with code if needed. Indeed, the best practice is to retrieve your org metadata and store it in a version control system such as Git. But let’s leave this topic for another blog post.
If you create or modify metadata with clicks in your org, and know the name of the metadata type that you want to retrieve, you can do it by running this command:
sf project retrieve start -m FlexiPage
Metadata type names may not be obvious at the beginning. Fortunately, there is something very cool that you can use to view all the metadata that exists in your org and retrieve what you need: Org Browser. The Org Browser gets added to VS Code thanks to the Salesforce Extensions for VS Code. Open it by clicking on the cloud icon at the left-hand side panel of VS Code, find the metadata that you need, and just click on retrieve!
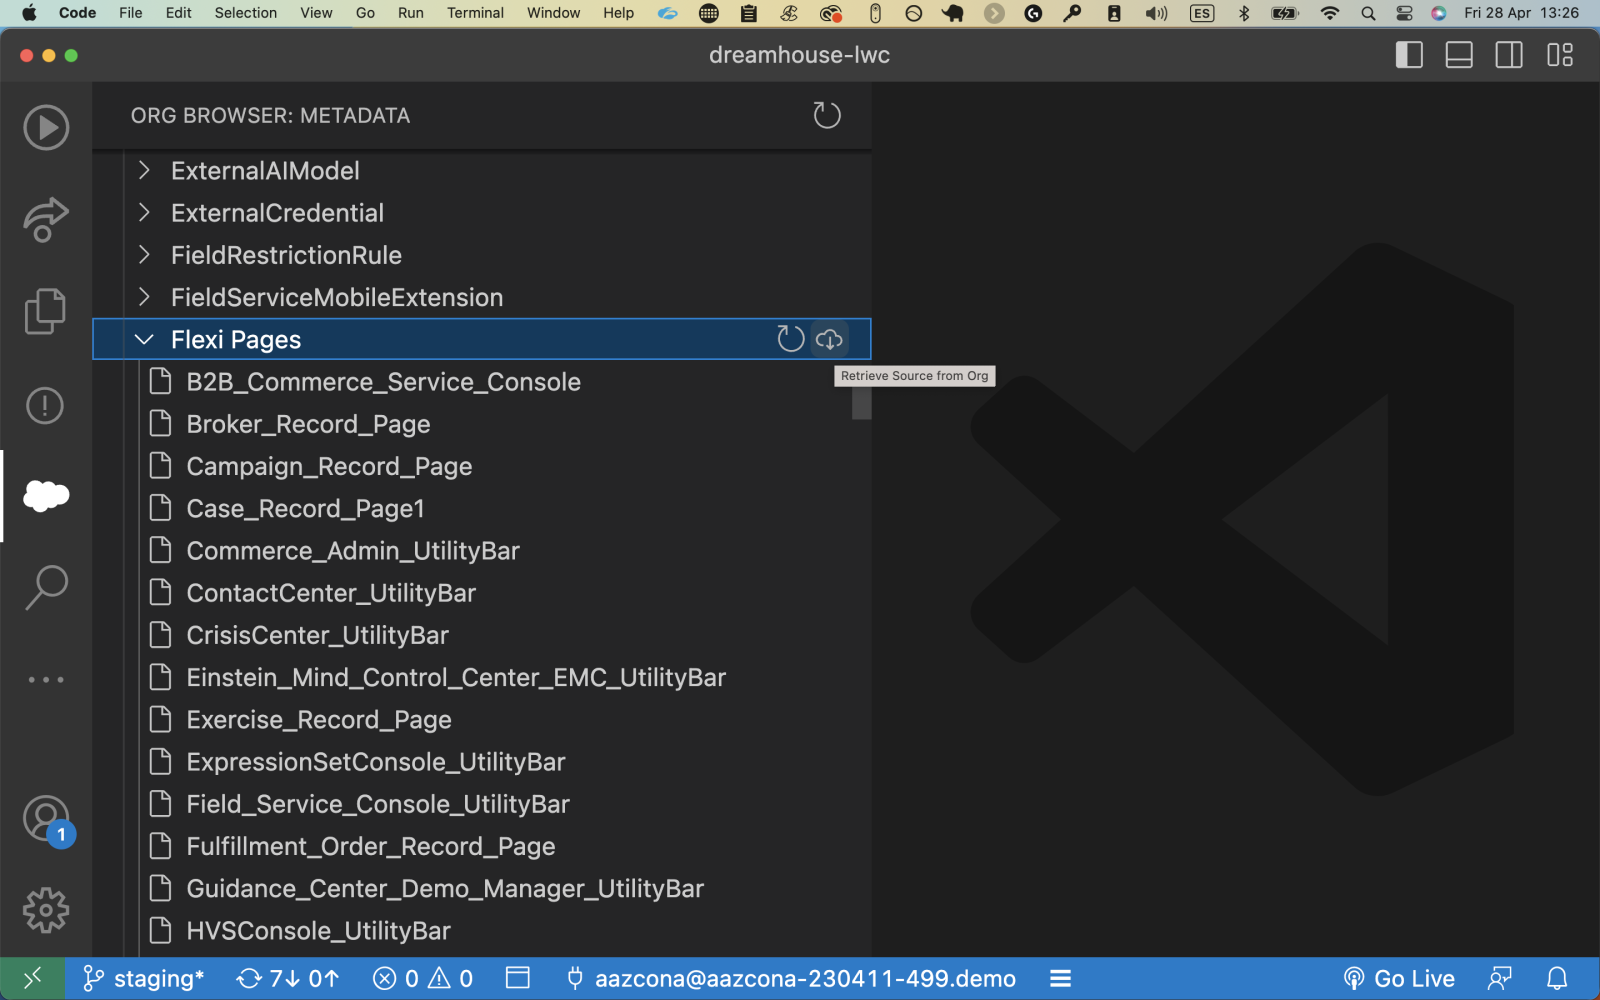
You can find a complete list of metadata type names in the Metadata API Developer Guide.
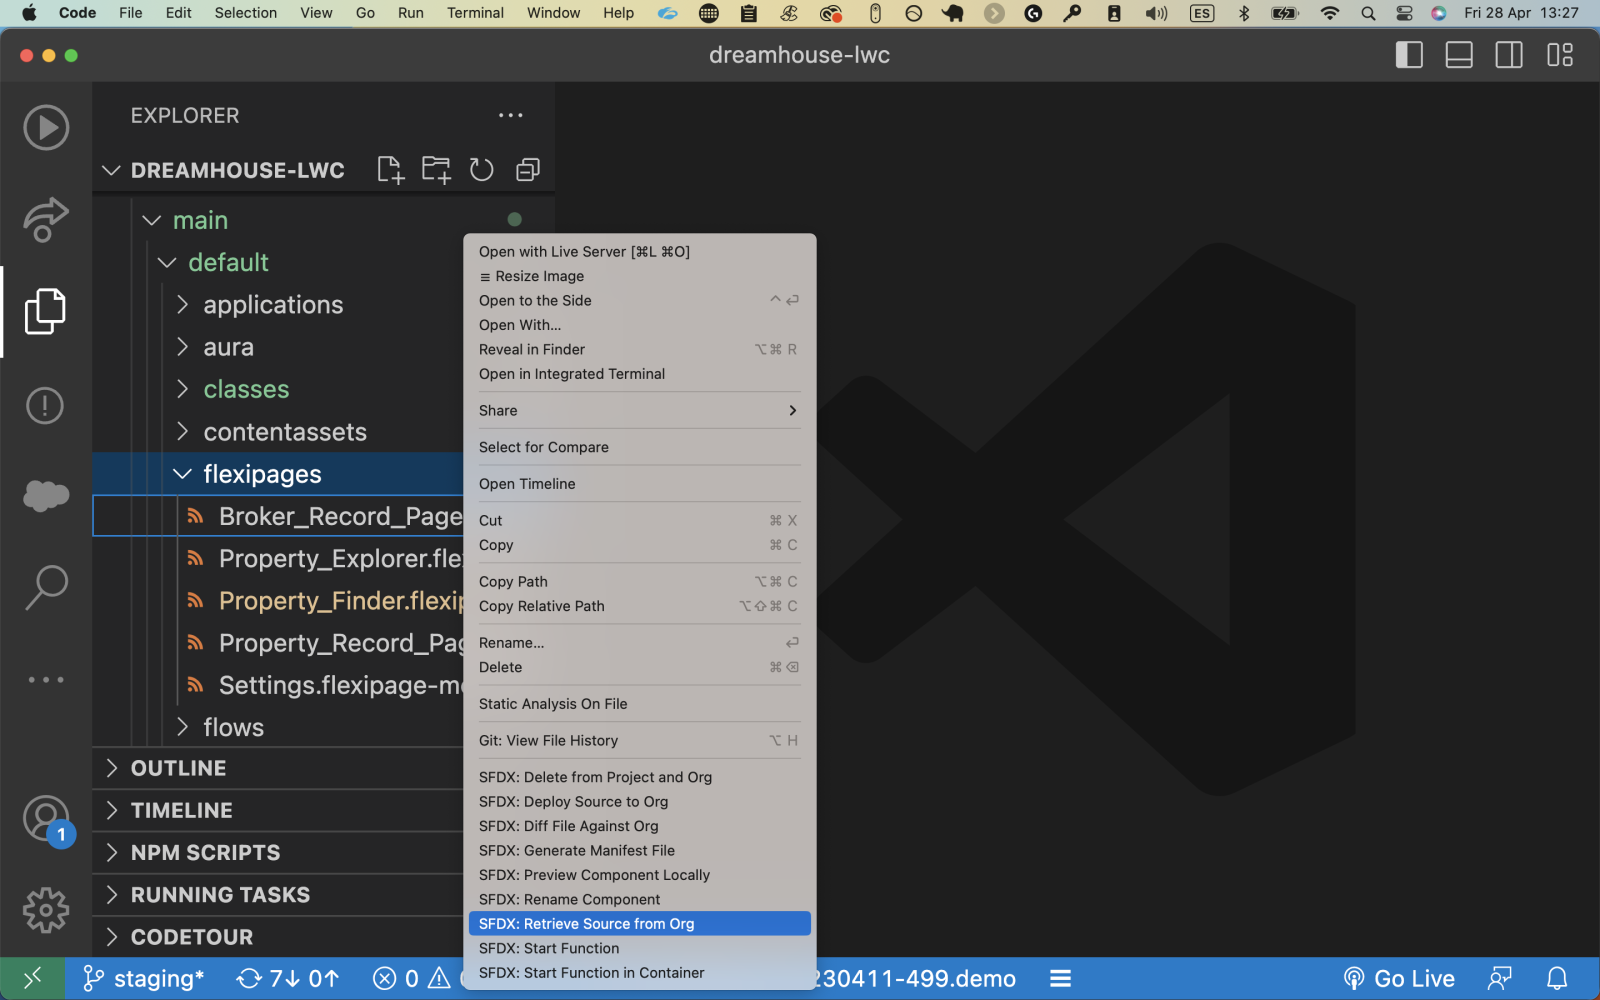
One last option: if the metadata already exists in your local project, and you want to retrieve an updated version of it, you can right-click on the file and select Retrieve Source from Org .
A common requirement for existing orgs will be to retrieve all the metadata from the org for the first time and store it in the local project (and typically a version control system). This is a more advanced topic, but if you want to learn how to do it, I recommend watching this Quick Take video.
Working with source-tracked orgs
In this blog post, we’ve focused on orgs that don’t have source tracking enabled. This is the default option for Developer orgs and sandboxes, although, in developer sandboxes, source tracking can be activated. There is another type of org, called a scratch org, that has source tracking activated by default.
The main difference with source-tracked orgs, in regards to deploying and retrieving code, is that metadata changes are tracked automatically for you. That means that you can simplify the deploy and retrieve commands, by just typing:
sf project deploy start
or
sf project retrieve start
Anything that was changed in your org, or in your local project, will be automatically detected by the CLI, and deployed or retrieved accordingly. This is a game changer for developers as not having to specify the metadata or folder to retrieve or deploy makes you a much more productive developer. Read the documentation to get started with source tracking in Sandboxes or Scratch orgs.
Looking after code quality with Node libraries
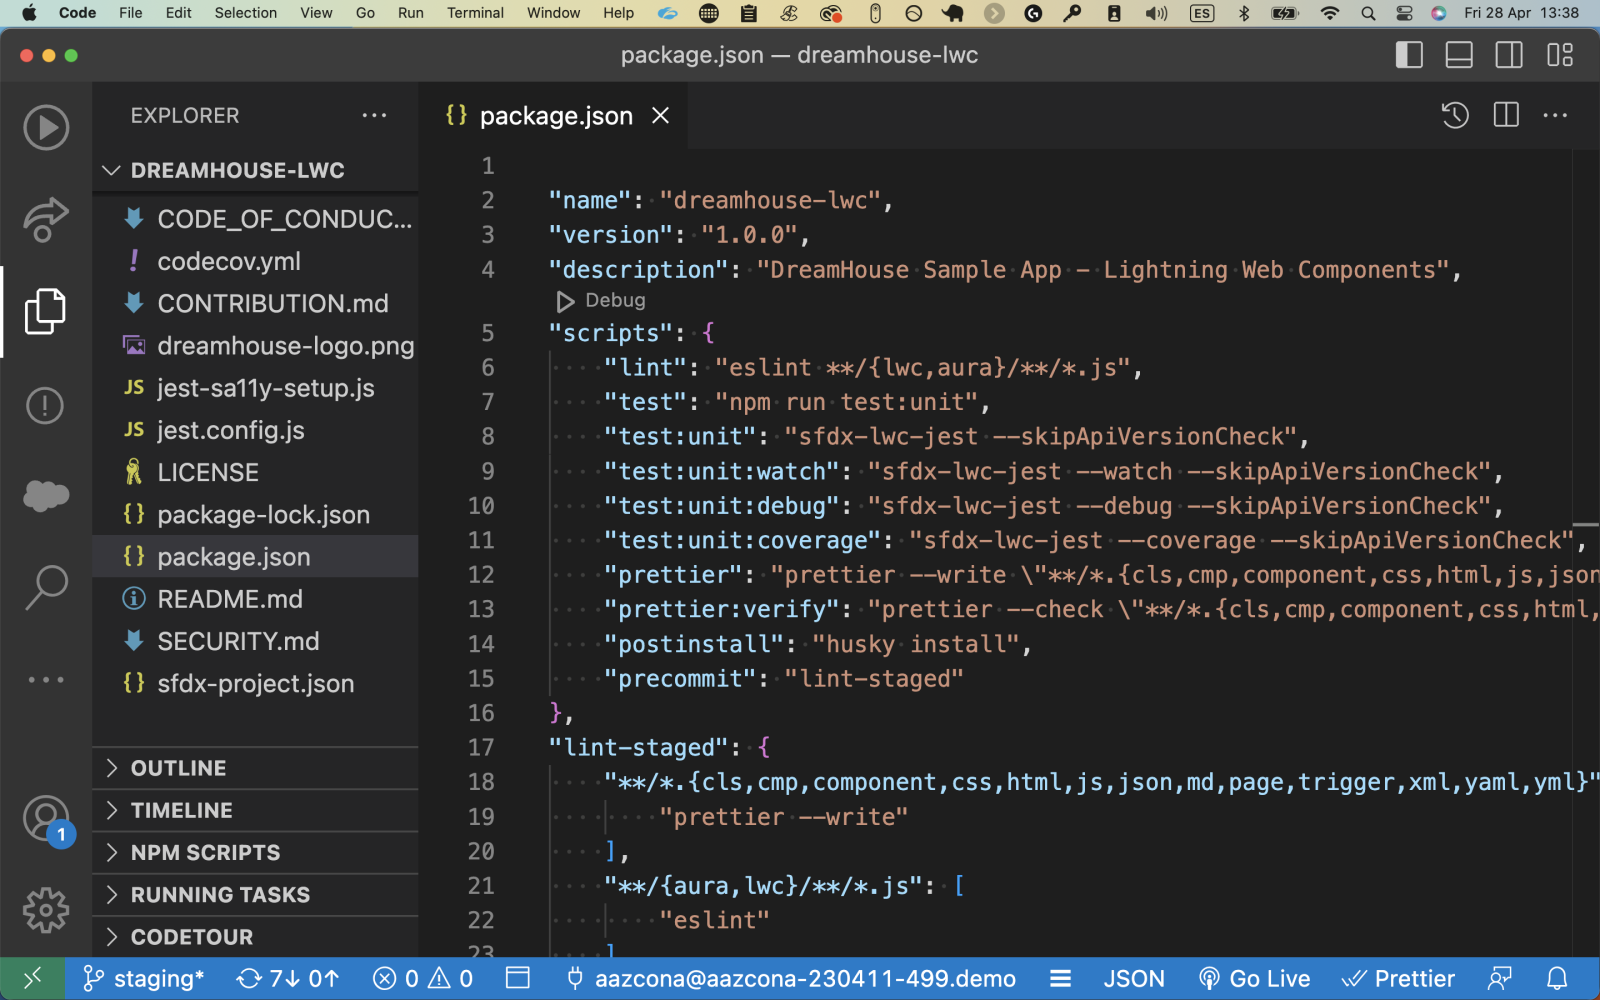
When you generate a project, it will also contain a package.json file. This file defines the project as a Node.js project. The Salesforce CLI and the Salesforce Extension for your IDE scaffold the project this way, so you can execute scripts that look after the quality of your code. The scripts use libraries that are defined in the devDependencies section of package.json and need to be downloaded to your local project by executing the npm install command. None of the Node libraries will be deployed to your org, they will just be used in your local machine.

Here is a summary of what the libraries do:
- Prettier is used to format your code following configurable criteria. This is extremely useful when several devs work on the same project as they have a unified and automated way of formatting the code. We also provide a specific Prettier plugin to format Apex classes.
- ESLint helps you find and fix problems with your JavaScript code. Additionally, we provide an ESLint plugin designed to lint your Lightning Web Components JavaScript code.
- sfdx-lwc-jest is used for writing and running Jest tests for your Lightning Web Components. sa11y is a plugin to write accessibility tests and make sure your components are accessibility friendly.
The entry point for using the libraries are the scripts defined in the scripts section.
The scripts can be executed locally, on demand, and in an automated way. Typically these scripts run automatically before committing your code to a code repository when merging your code with code developed by others, or when moving changes between environments in your pipeline. This ensures the code has the quality expected, and your functionality doesn’t break. This concept is known as Continuous Integration, and you can watch a nice codeLive video about it.
Using these libraries is not compulsory, but we strongly recommend doing it. To know more about this topic, read our blog post.
Other gems of the Salesforce Extensions for VS Code
That’s not all about Salesforce Extensions. They add to VS Code many more capabilities, such as syntax highlighting, code completion, and CSS validation for Lightning Web Components, Aura Components, Apex, SOQL, and Visualforce.
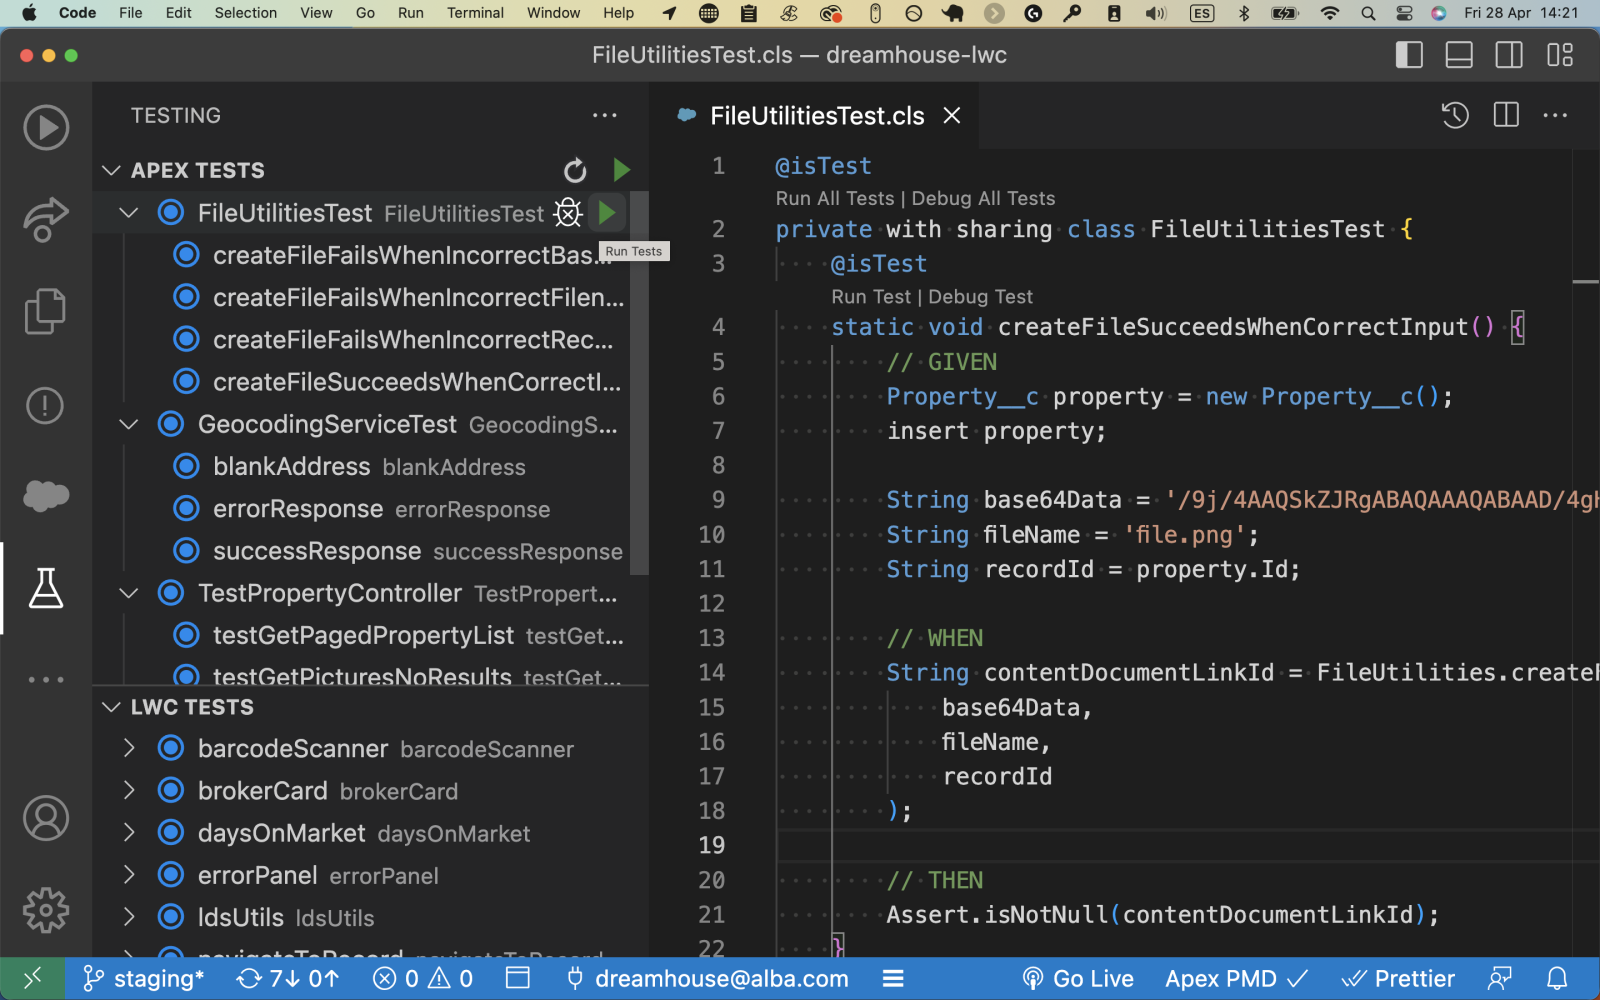
They also surface a testing tab that makes it much easier to execute and write Apex and Lightning Web Components tests.
And finally, they also make it easier to debug Apex, thanks to the Apex Replay Debugger.

On top of that, something very cool about VS Code is that you can add tons of extensions built by developers from all the different ecosystems. There are extensions to help you with version control and with code static analysis (such as PMD). There are extensions for Prettier and ESLint that give you warnings when the code does not comply with their rules. There are extensions for almost everything that you may need, even for using Chat GPT! Take a look at the VS Code Marketplace to see all the extensions available, or even better, create your own!
Conclusion
Wow, that was a lot! In this blog post, you’ve learned about the developer tools that every Salesforce Developer should know and use. By mastering these tools, you’ll become a much more productive, faster, and happier developer. If you want to learn all this content in video format, watch our codeLive episode. If you work with sandboxes, you can expand your knowledge about working with sandboxes and the Salesforce CLI by reading our blog post series. And if you have questions, don’t hesitate to ask them in the Salesforce Developers Trailblazer Community. Happy coding!
About the author
Alba Rivas works as a Principal Developer Advocate at Salesforce. You can follow her on Linkedin, Twitter, or GitHub.